I would like to hear from those that picked this one up yesterday late afternoon. Initially estimated at 8.0 but revised down to 7.6. I picked it up in Idaho, 4300 km away. Appeared to be aftershakes; Wondering if those in the know would be able to pick up where the S wave starts and/or calculate from the P - S timing, how one would go about determining distance. Also 15 min later there was a bizarre wavy pattern to the tracing and wondered if that was real. The quake frequency was most intense between 0.7 and 1.7 Hz. I tried to get Scholar GPT to interpret but it was all over the place. Not sure if images will show up here. -Mario
1 Like
Hello Mario,
Definitely a well-received P-wave there, that’s for sure!
I’ve checked some stations at various distances that fall in your 4300km range, as I suspect that the S wave has attenuated too much to be properly detected at your location.
Not considering the very close ones, this is one Shake at 600km:
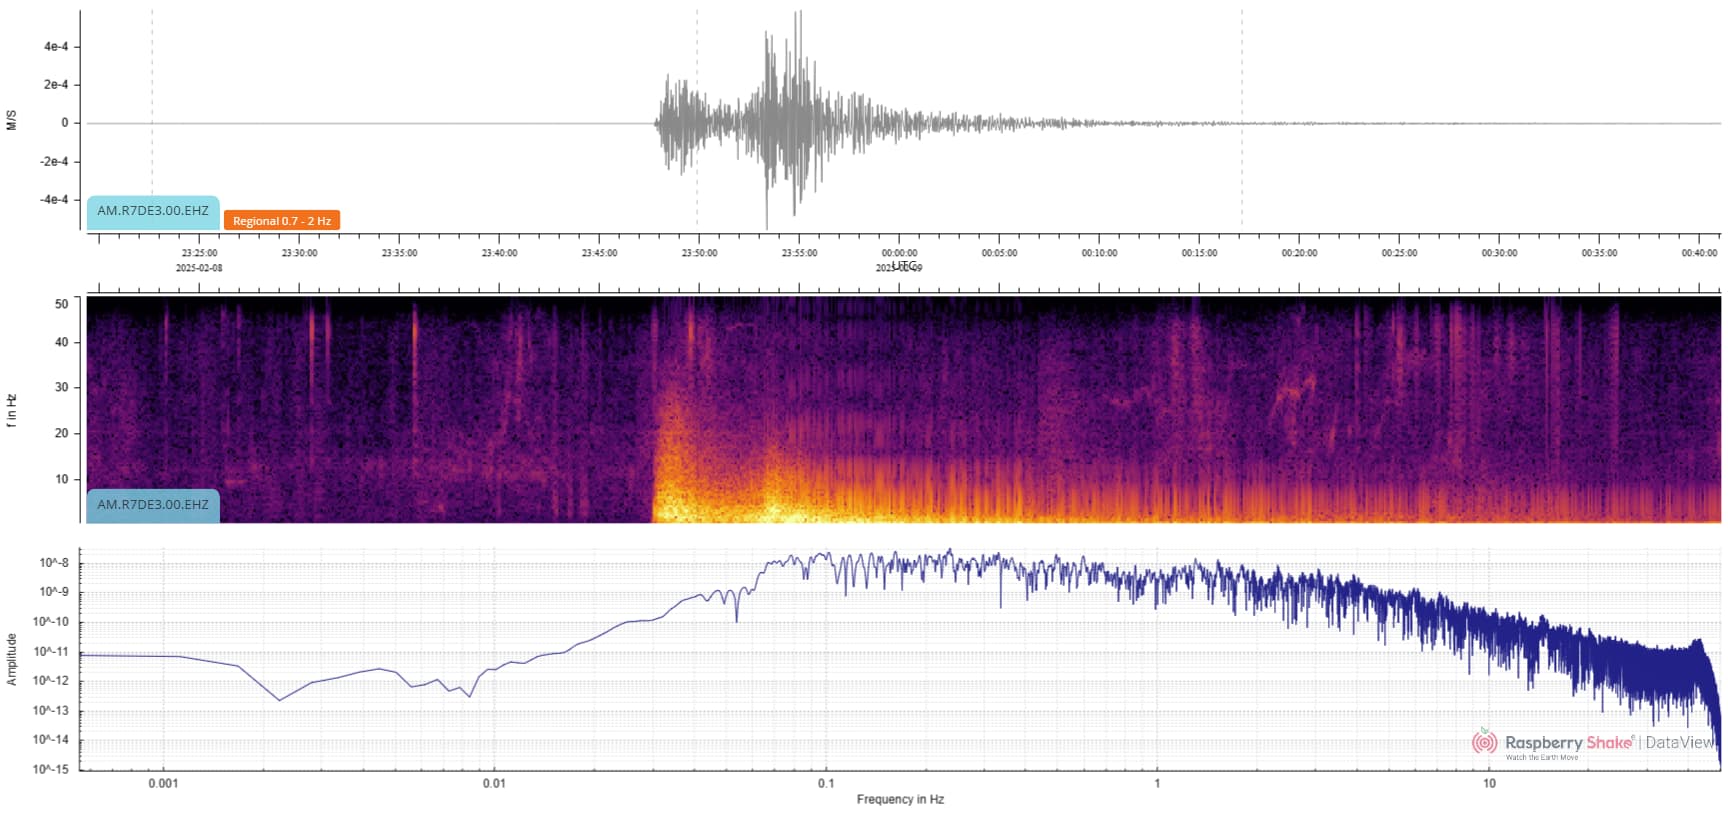
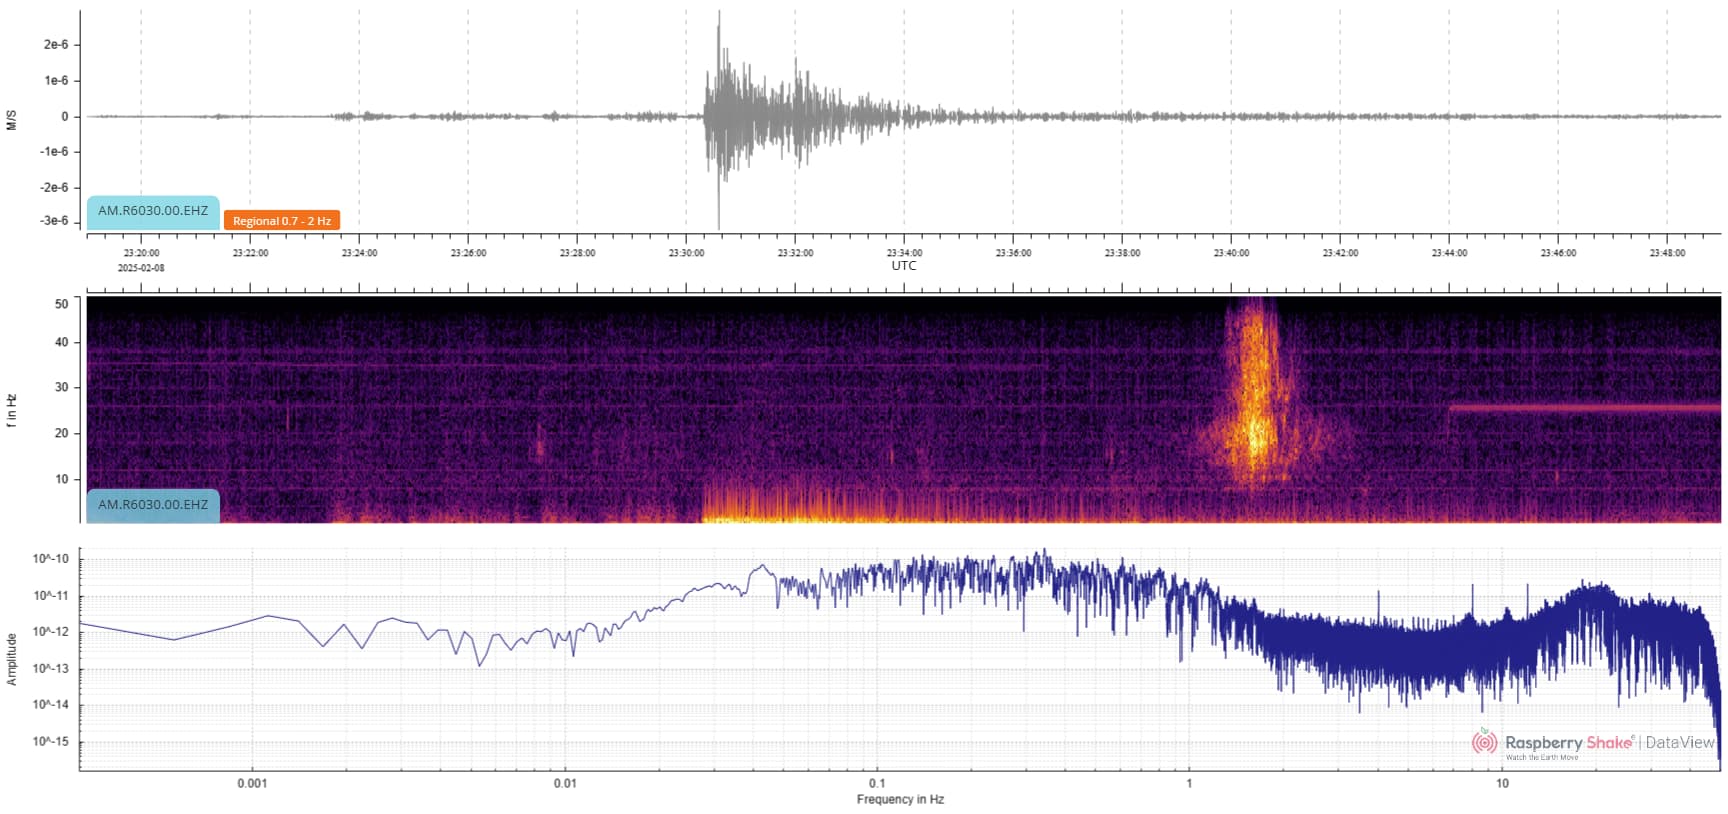
This one is at 1500km:
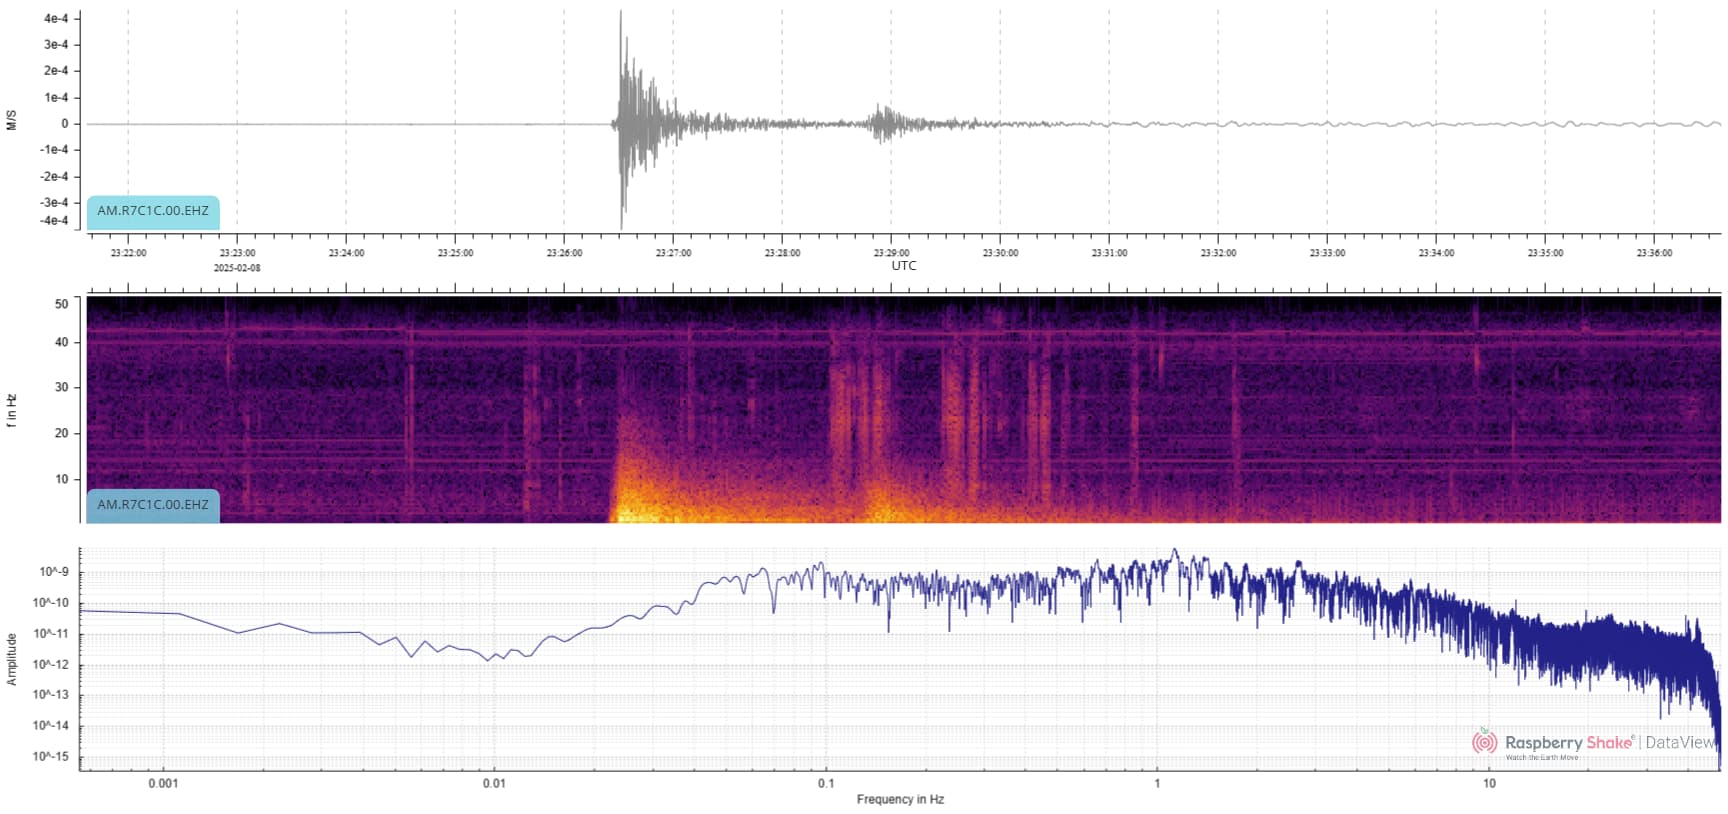
This is one at 2300km:
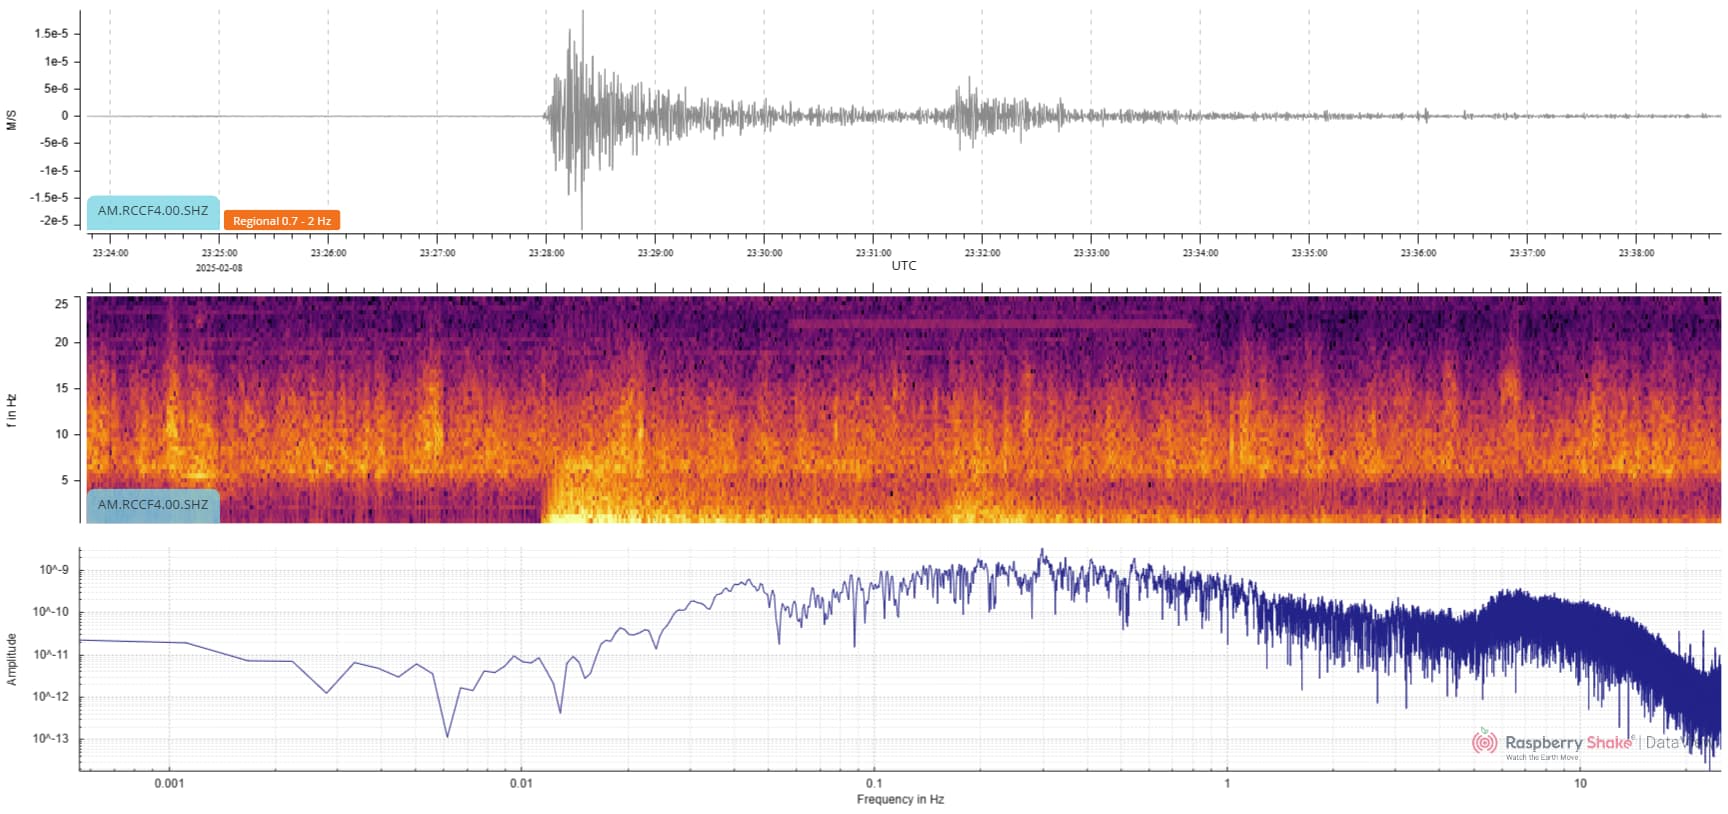
This is one at 3200km:
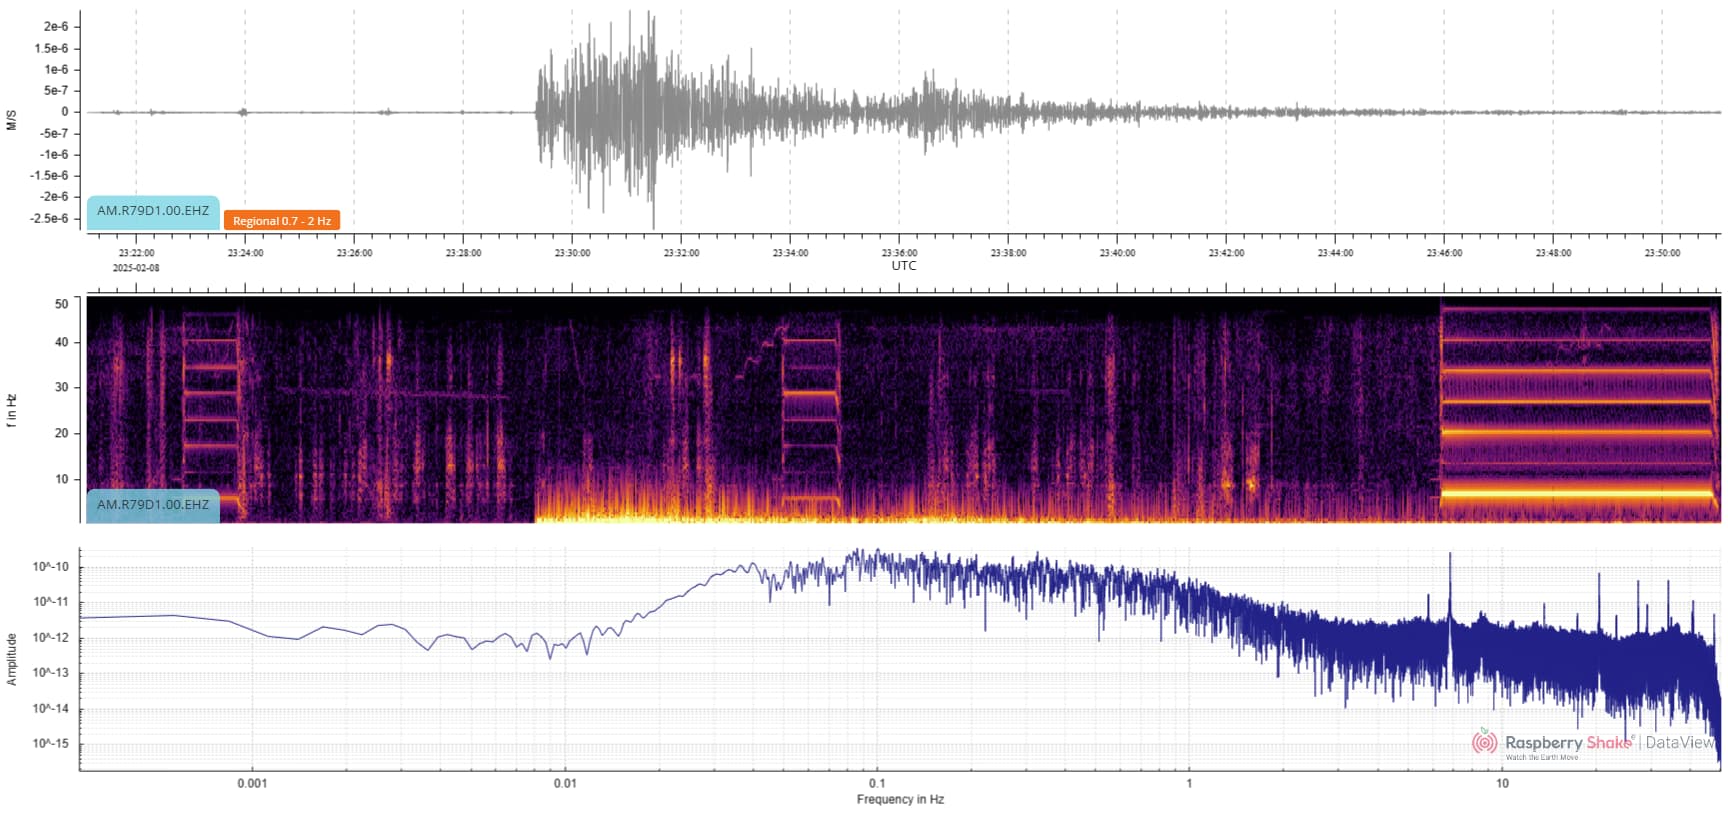
This is at 4000km:
As you can observe, the S-wave continues to decrease in amplitude as distance increases, becoming more or less indistinguishable and “lost” before reaching your Shake. S waves present a more rapid attenuation compared to P waves, and they can “disappear” from view at farther distances.
To estimate when you can expect the S waves at your station (distance), you can use a combination of tools:
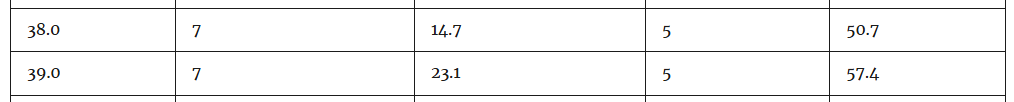
1a) Convert km to degrees using this website (Convert degrees to kilometers), with 6378km as the circle radius (Earth’s radius). For your distance (4300km) you get 38.62 degrees.
1b) Use this value in this table (https://www.usgs.gov/programs/earthquake-hazards/earthquake-travel-times) to discover that the S wave (third/fourt columns - minutes | seconds) should have arrived around 6 minutes after the P wave (first/second columns, always in minutes | seconds)
2.) Use this IRIS tool: NSF SAGE: IRISWS: Traveltime: Docs: v. 1: Builder, which can be more straightforward. By inputting your data:
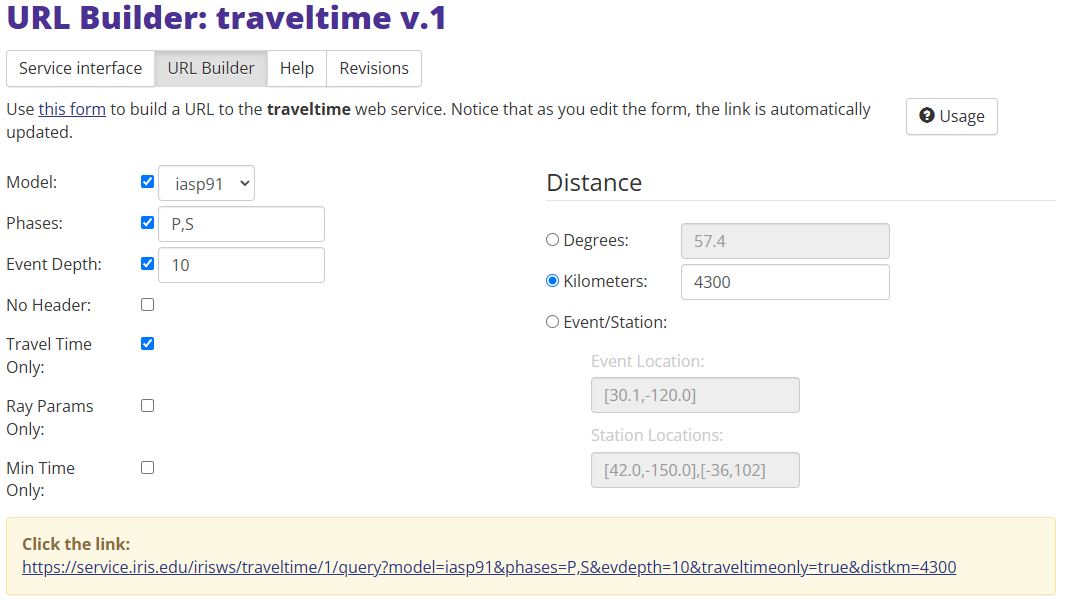
you get the following result:
443.64752 801.16962 (which is in seconds, you can use this to convert it to mm:ss, Seconds to Minutes Converter - Unit Converter).Which gives the same value of around 6 minutes difference.
To answer your question (after this maybe too long exposition), you could (very roughly) approximate the earthquake epicenter distance radius by using only the P wave arrival time and an average P-wave speed (which is typically about 5-8km/s) using the USGS table at the page linked above.
However, this method can be imprecise due to our:
- P-wave speed assumptions
- earthquake origin time (that we don’t have in this example) assumptions.
So the calculations may be off by hundreds of km using only a single station. Multiple stations could help refine the calculation, but the best method is always using the P-S difference, as you know. That’s why station density matters!
Regarding your last question about the wavy pattern… those are surface waves from the same earthquake. If you use our new Rayleigh/Love Waves filter in Data View, you can very easily highlight them.
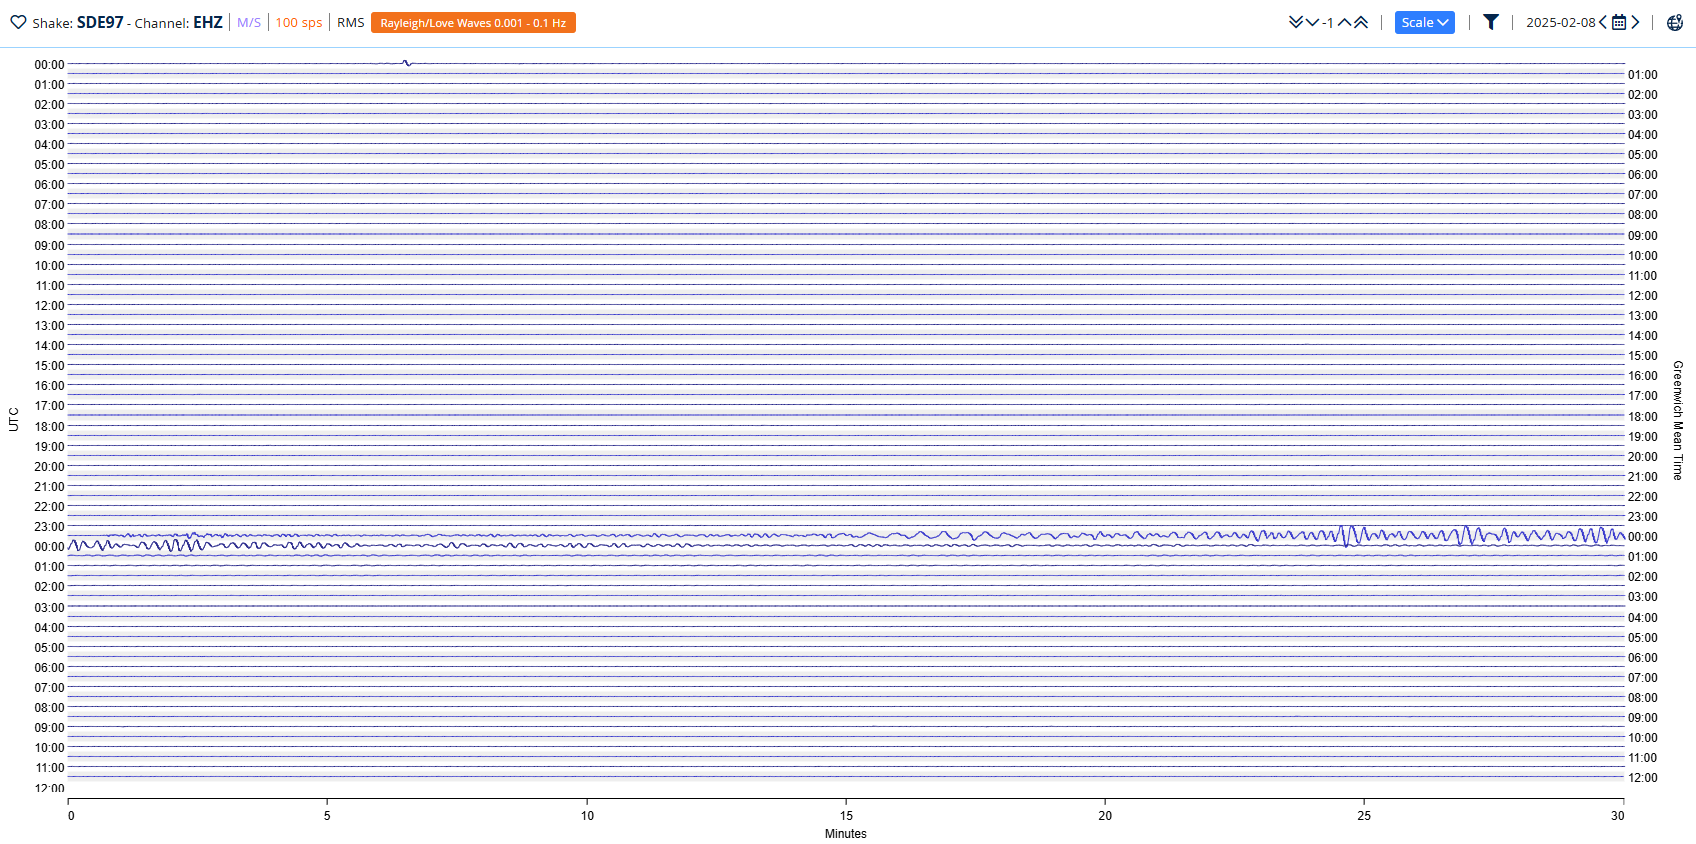
I was able to detect them here on the other side of the Atlantic too, arriving around 30 minutes after the event.
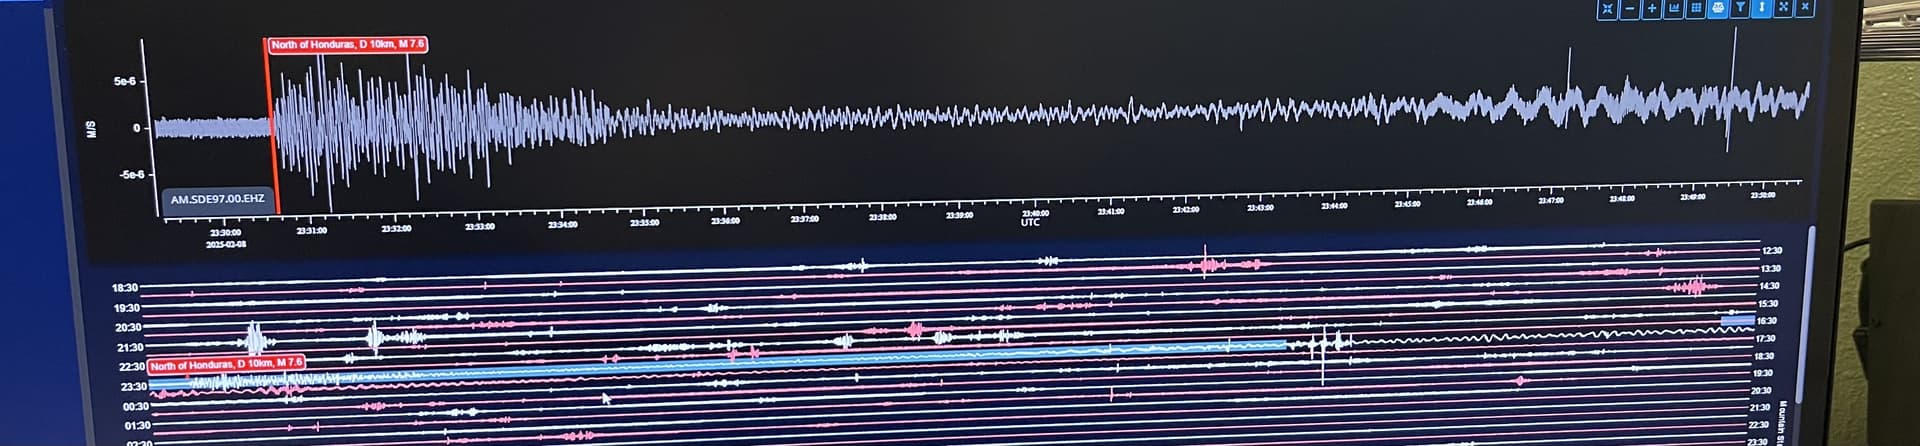
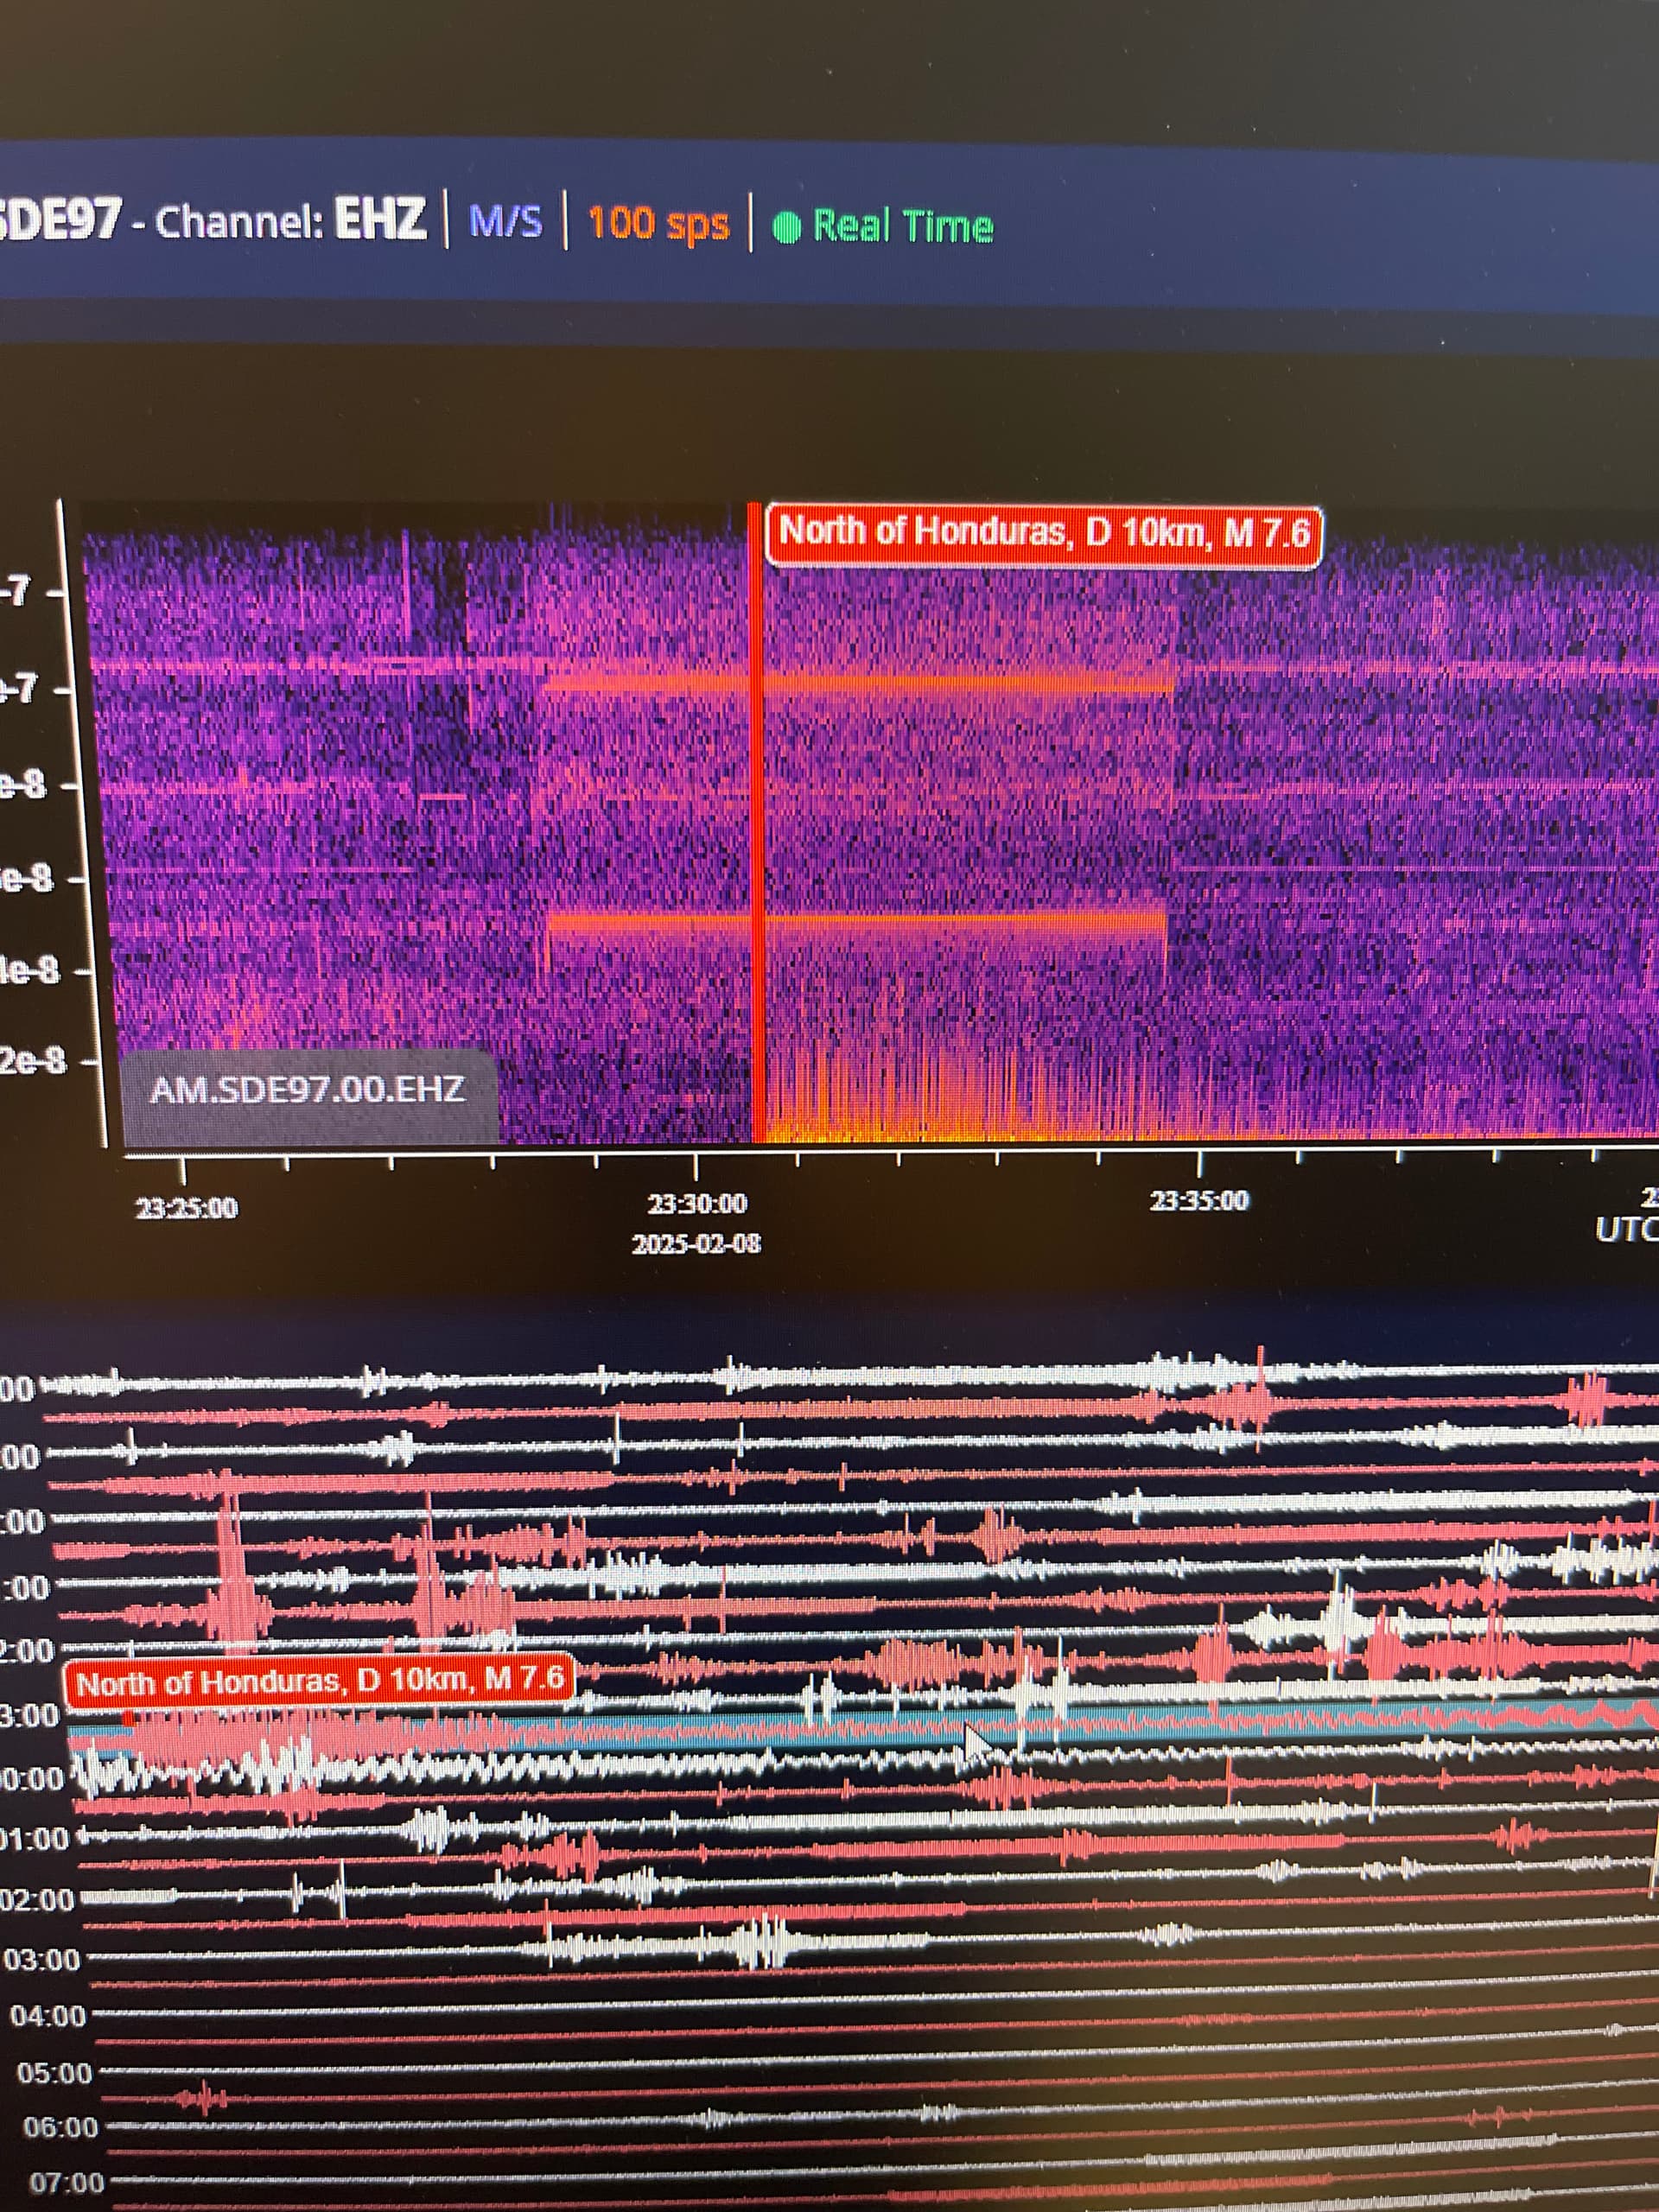
Here is my screen shot…
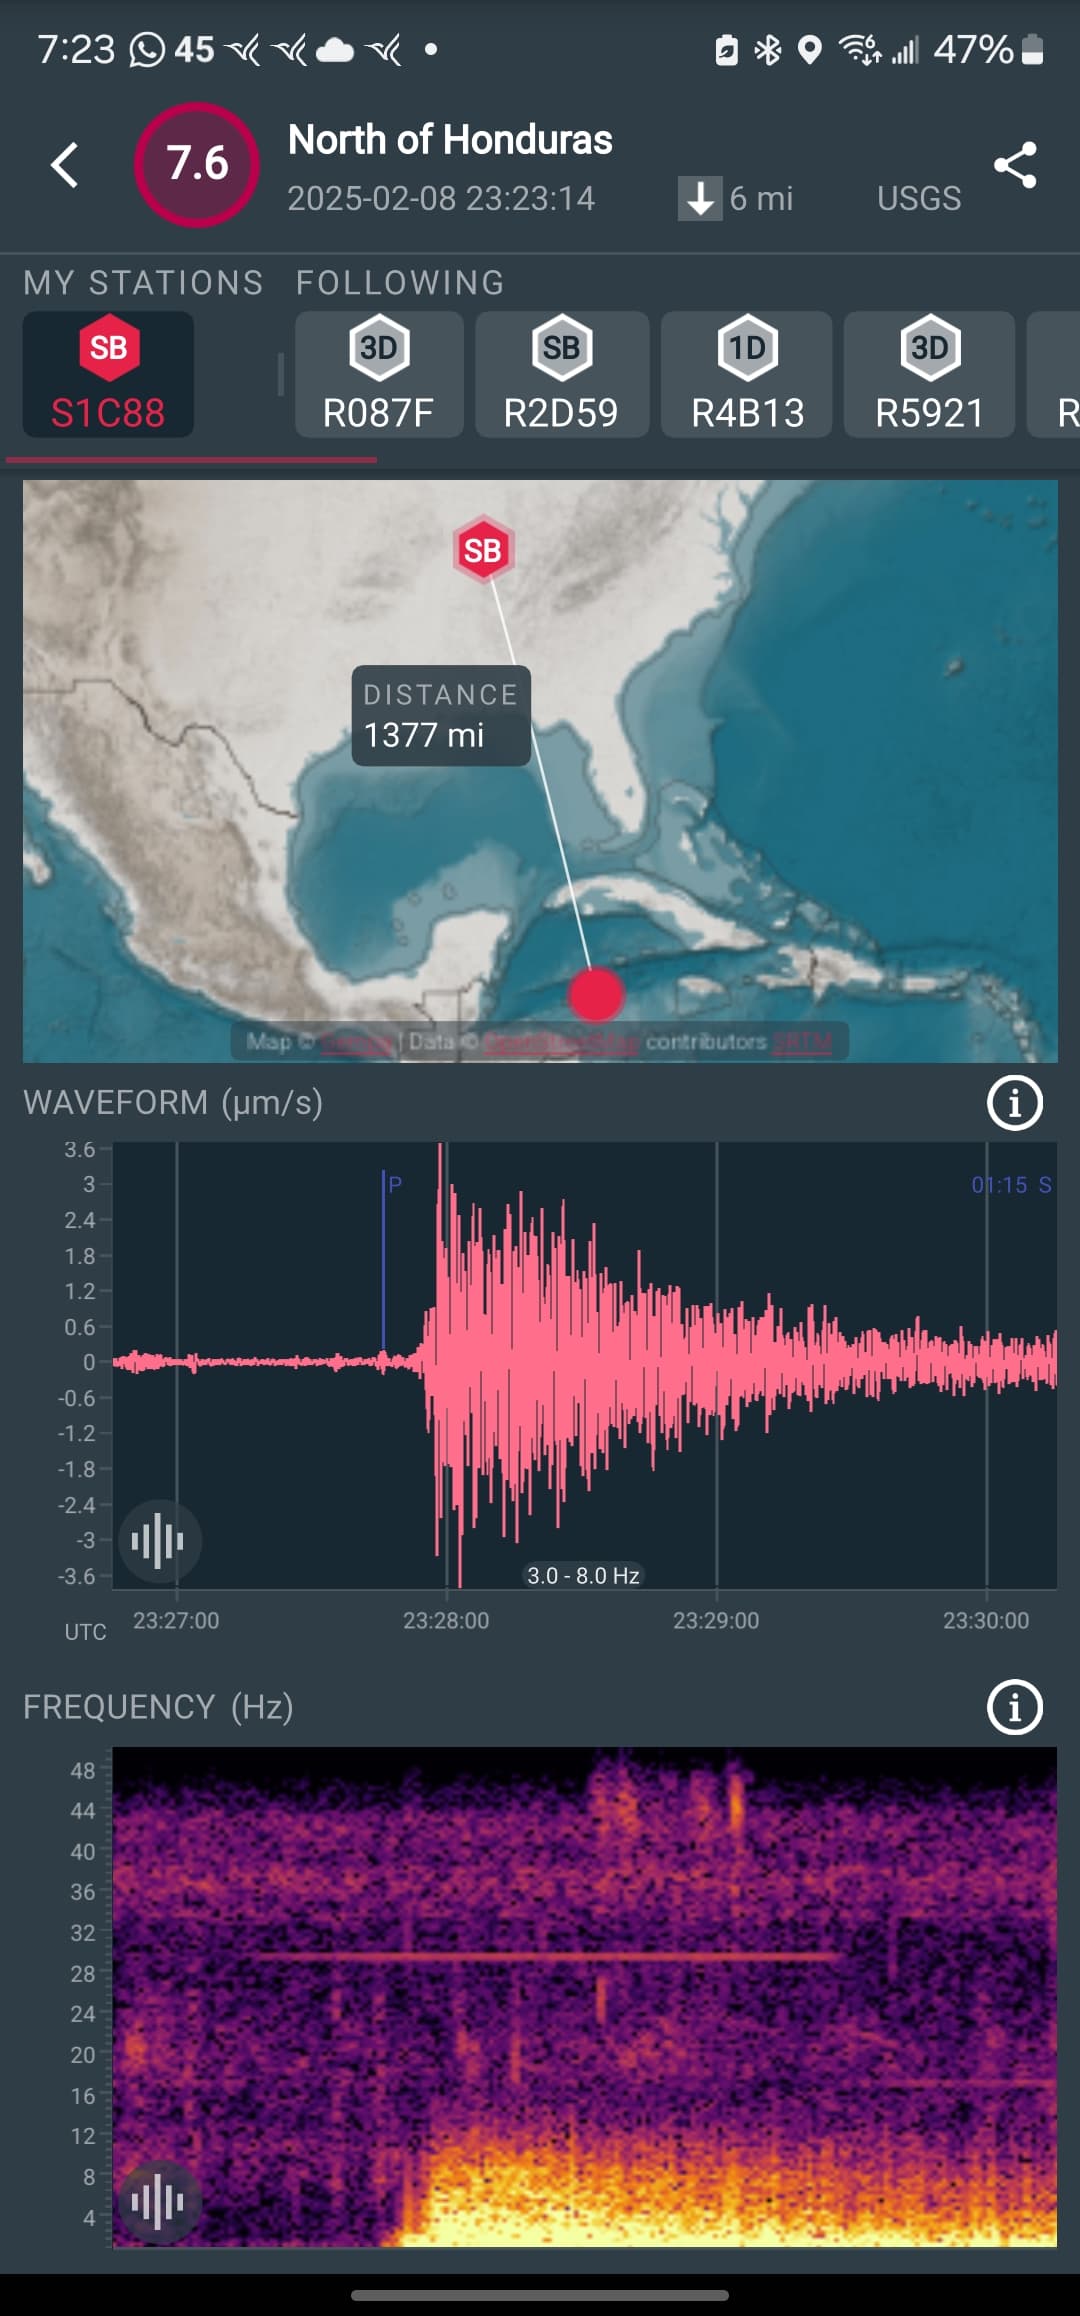
My strongest quake since coming online (that I’ve been able to detect easily).
2 Likes
Nice! I created a thread for this earthquake over on discord (Raspberry Shake's Community)
Thread: Discord
FYI @The1930srust @SRAF
branden
2 Likes