Dear all,
At a construction site in our neighborhood today measures have led to strong vibrations.
How can I present the results of my shake in a way that laymen understand that the vibrations were strong (local magnitude?)?
Kind regards
Dear all,
At a construction site in our neighborhood today measures have led to strong vibrations.
How can I present the results of my shake in a way that laymen understand that the vibrations were strong (local magnitude?)?
Kind regards
Hello jheiler,
I’m not sure if there is something ready-to-use for building/construction works, but you could probably use the method developed by Richter in 1932, which utilizes the max amplitude of the oscillations and the distance from the event to estimate the magnitude: Earthquakes Booklet - Measuring the Size of an Earthquake
Another comparison you can do is between the max amplitude in m/s and the ground motion estimation in the table on this page: Strong ground motion - Wikipedia
Probably the second one could be adapted easily in laymen terms to explain that the vibrations you felt were strong.
What I use, and it works for most local signals, is to look at the frequency:
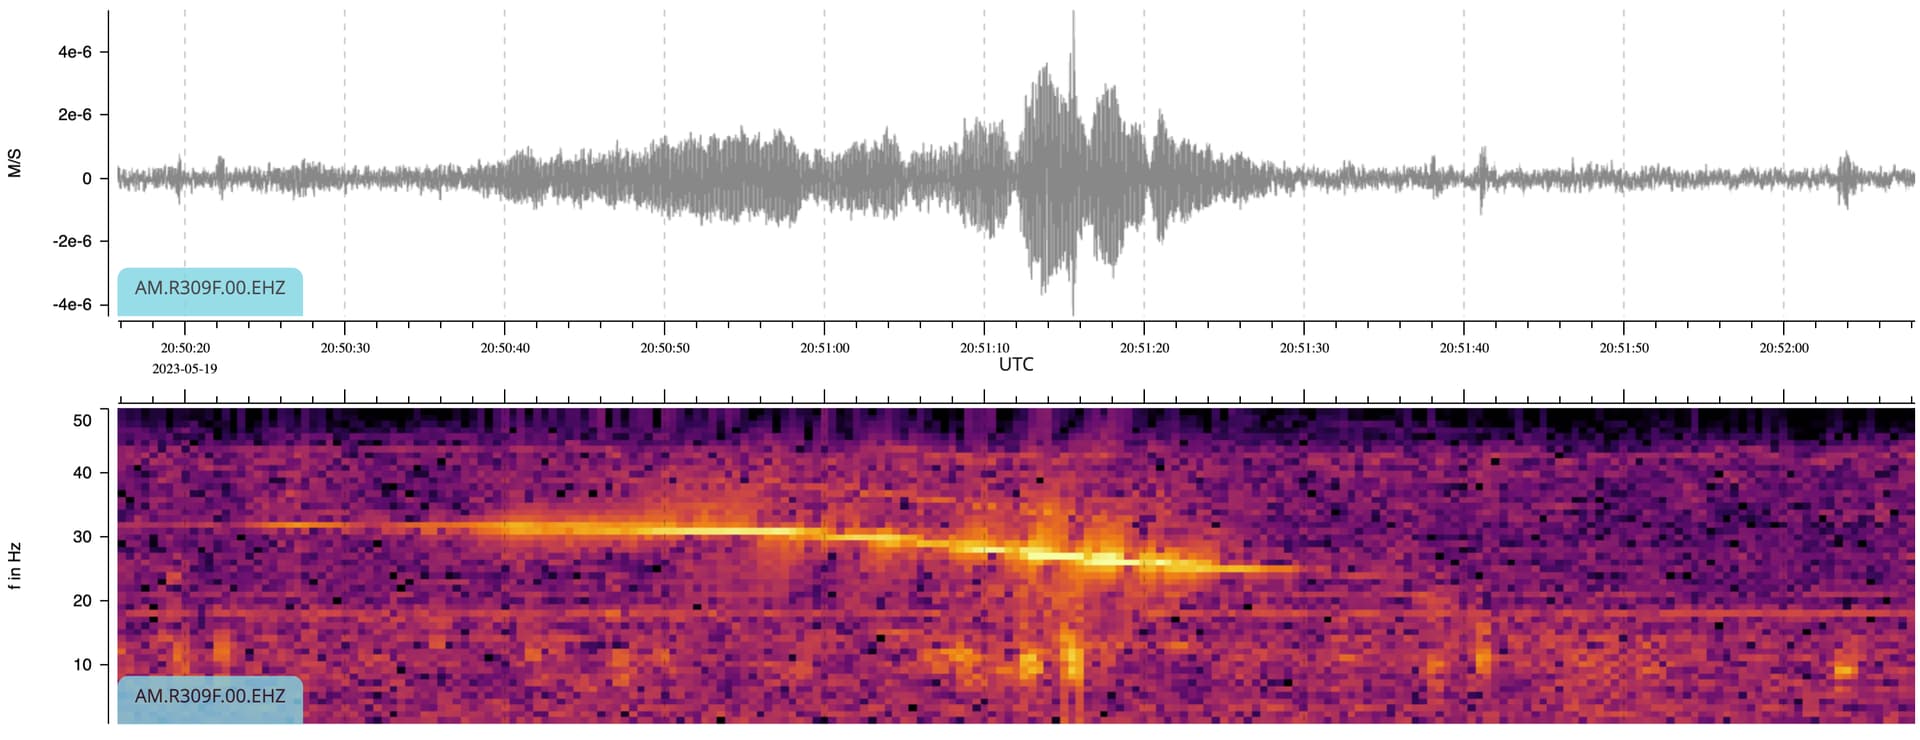
This is an earthquake (5.5, about 340 miles away). Note that you can see the individual excursions of the trace (depends on the scale you choose, of course). But it is mostly low frequency - I have no filtering applied. Looking at the frequency display below, it is clear that most of the energy is very low frequency.
This is typical of an earthquake spectrum.
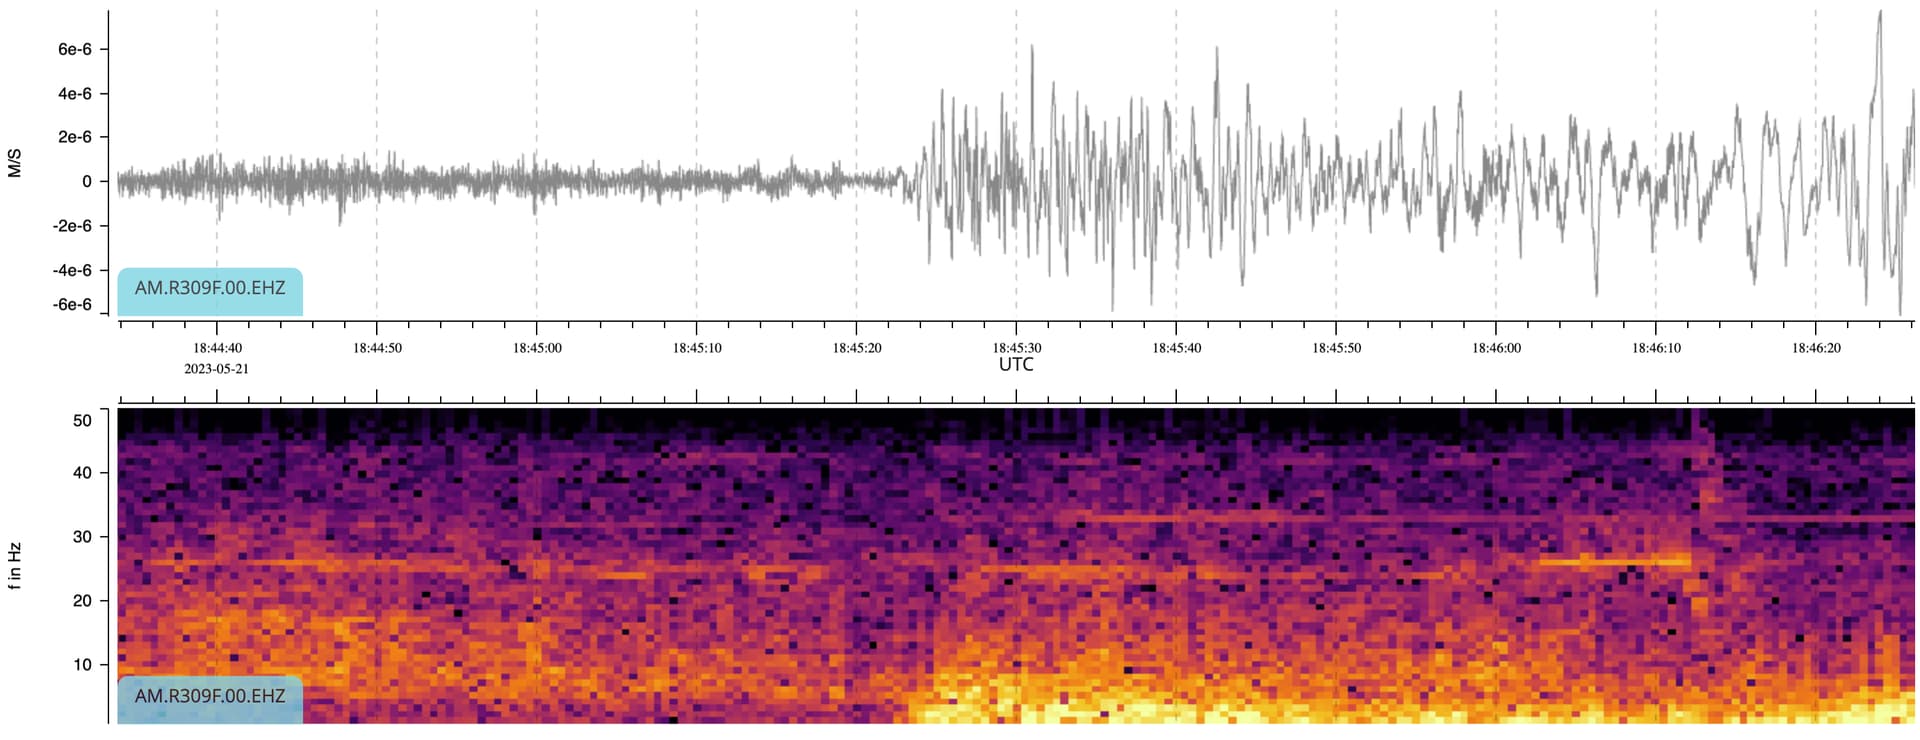
Now, local “interference”:
Just looking at the signal, it is higher frequency, “blocked in” rather than seeing the individual excursions.
It becomes even more clear looking at the spectrum display. The energy is higher frequency, and grouped into specific frequencies, with fairly sharp steps.
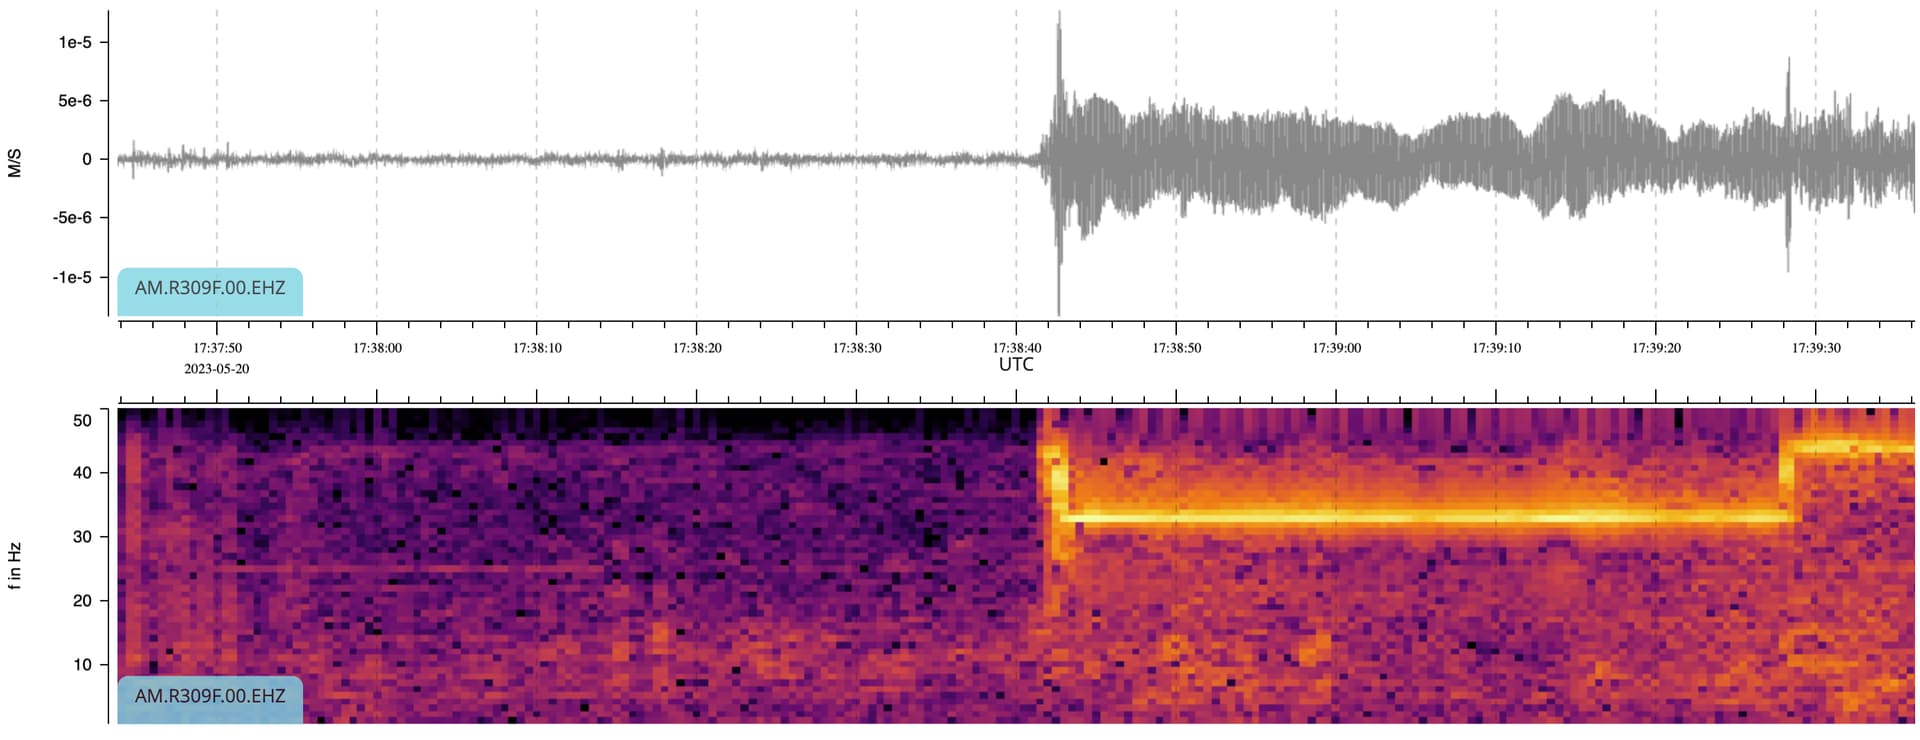
Helicopters are quite distinctive, with the doppler effect clearly visible on the spectrogram:
My point is, almost all human cause interference is distinguishable by looking at the frequencies involved. If it begins sharply, and is all clustered along the bottom of the spectrograph, it is most probably an earthquake. If the spectrogram shows little to no low frequencies, mostly clustered higher and especially if there are single frequency “bright” lines, it is virtually certainly man made.
A local earthquake will have frequencies spreading into the higher end, but still, most will be very low.
Hope this helps - at least a little!
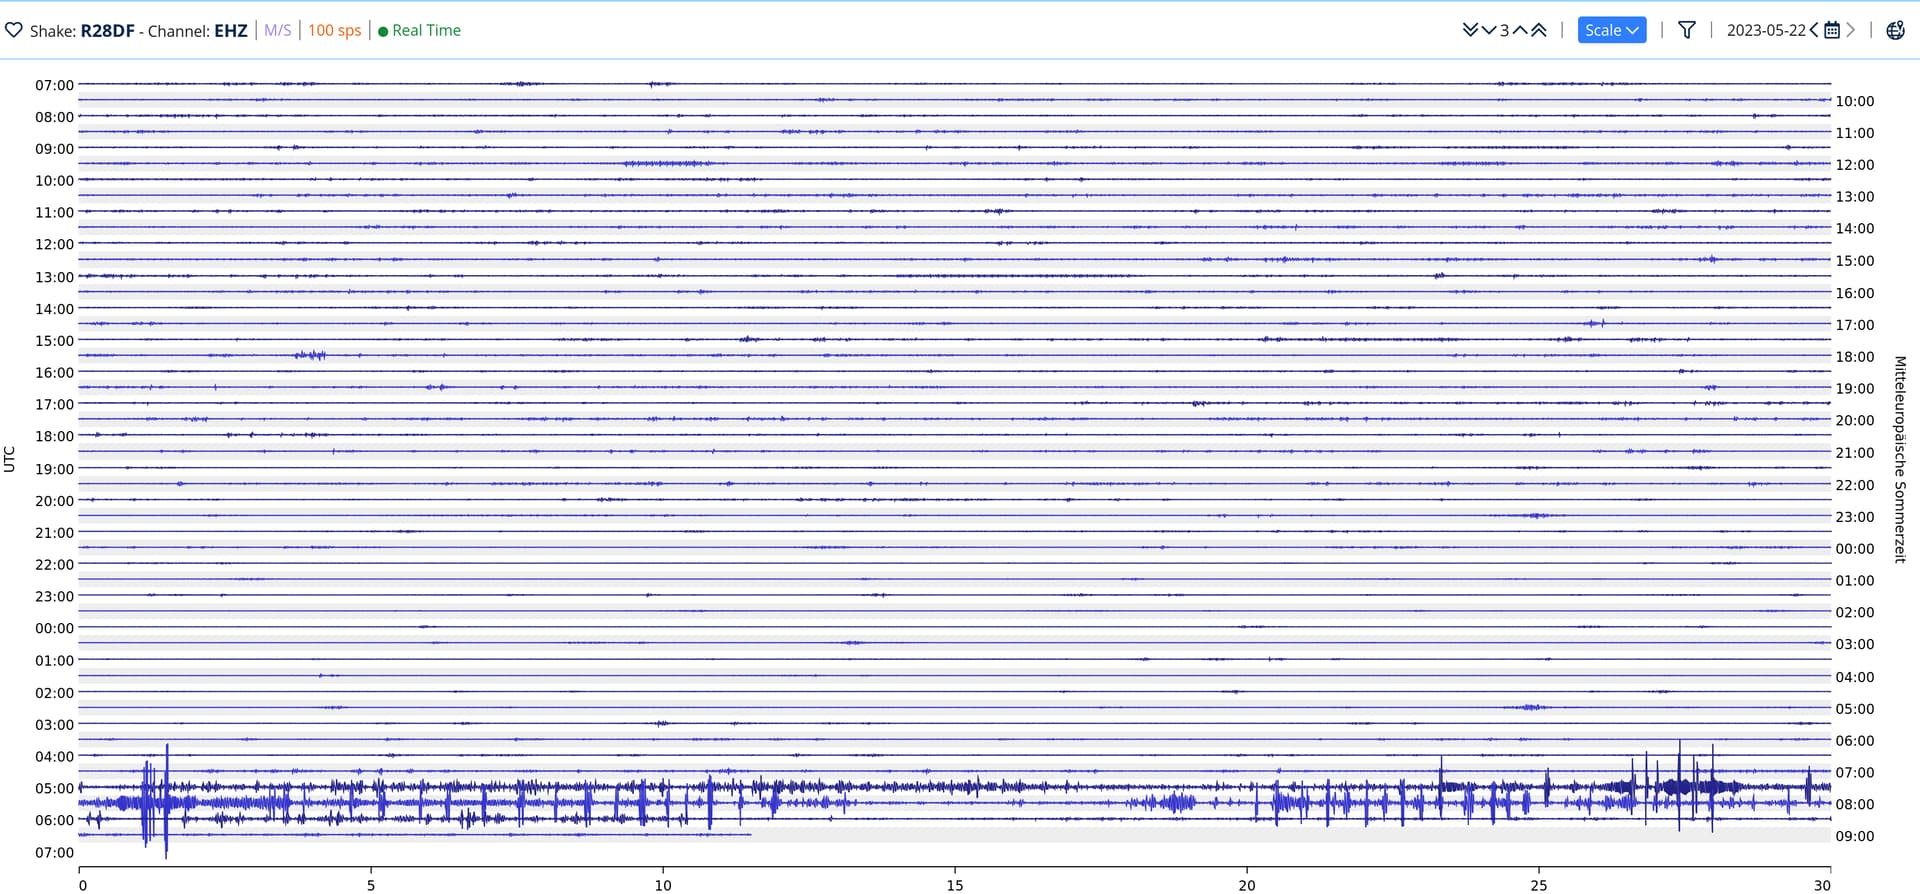
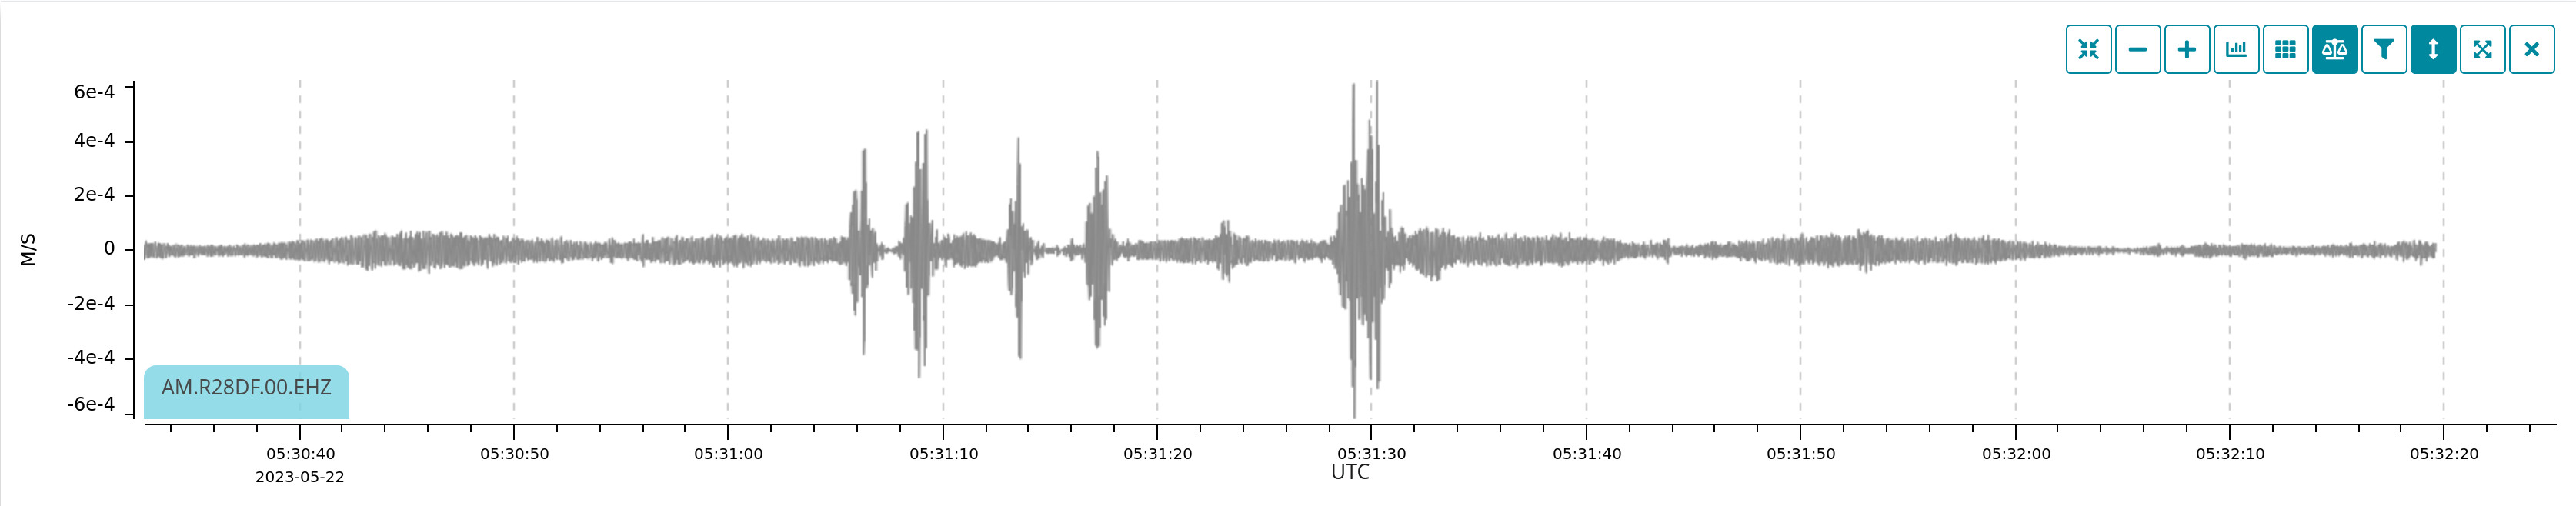
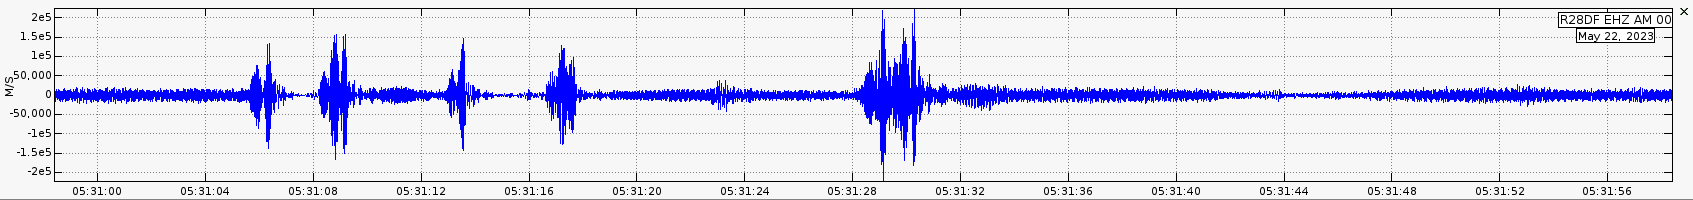
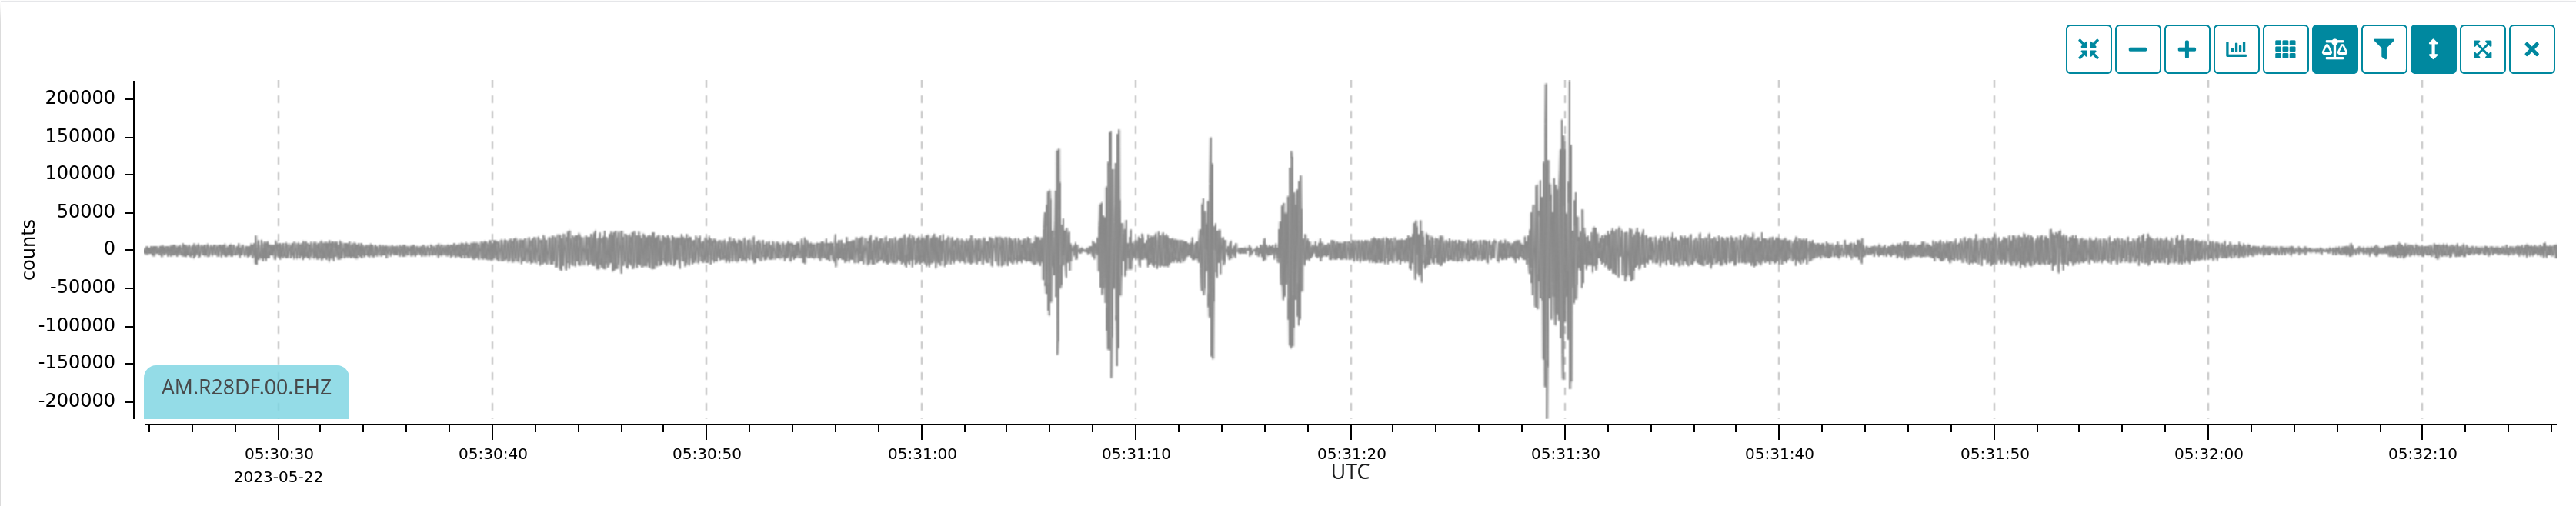
Thank you so far. I enclose screenshots from Dataview and Swarm, maybe someone can help me to define the max. ground motion, I am a bit confused.
Kind regards
Hello jheiler,
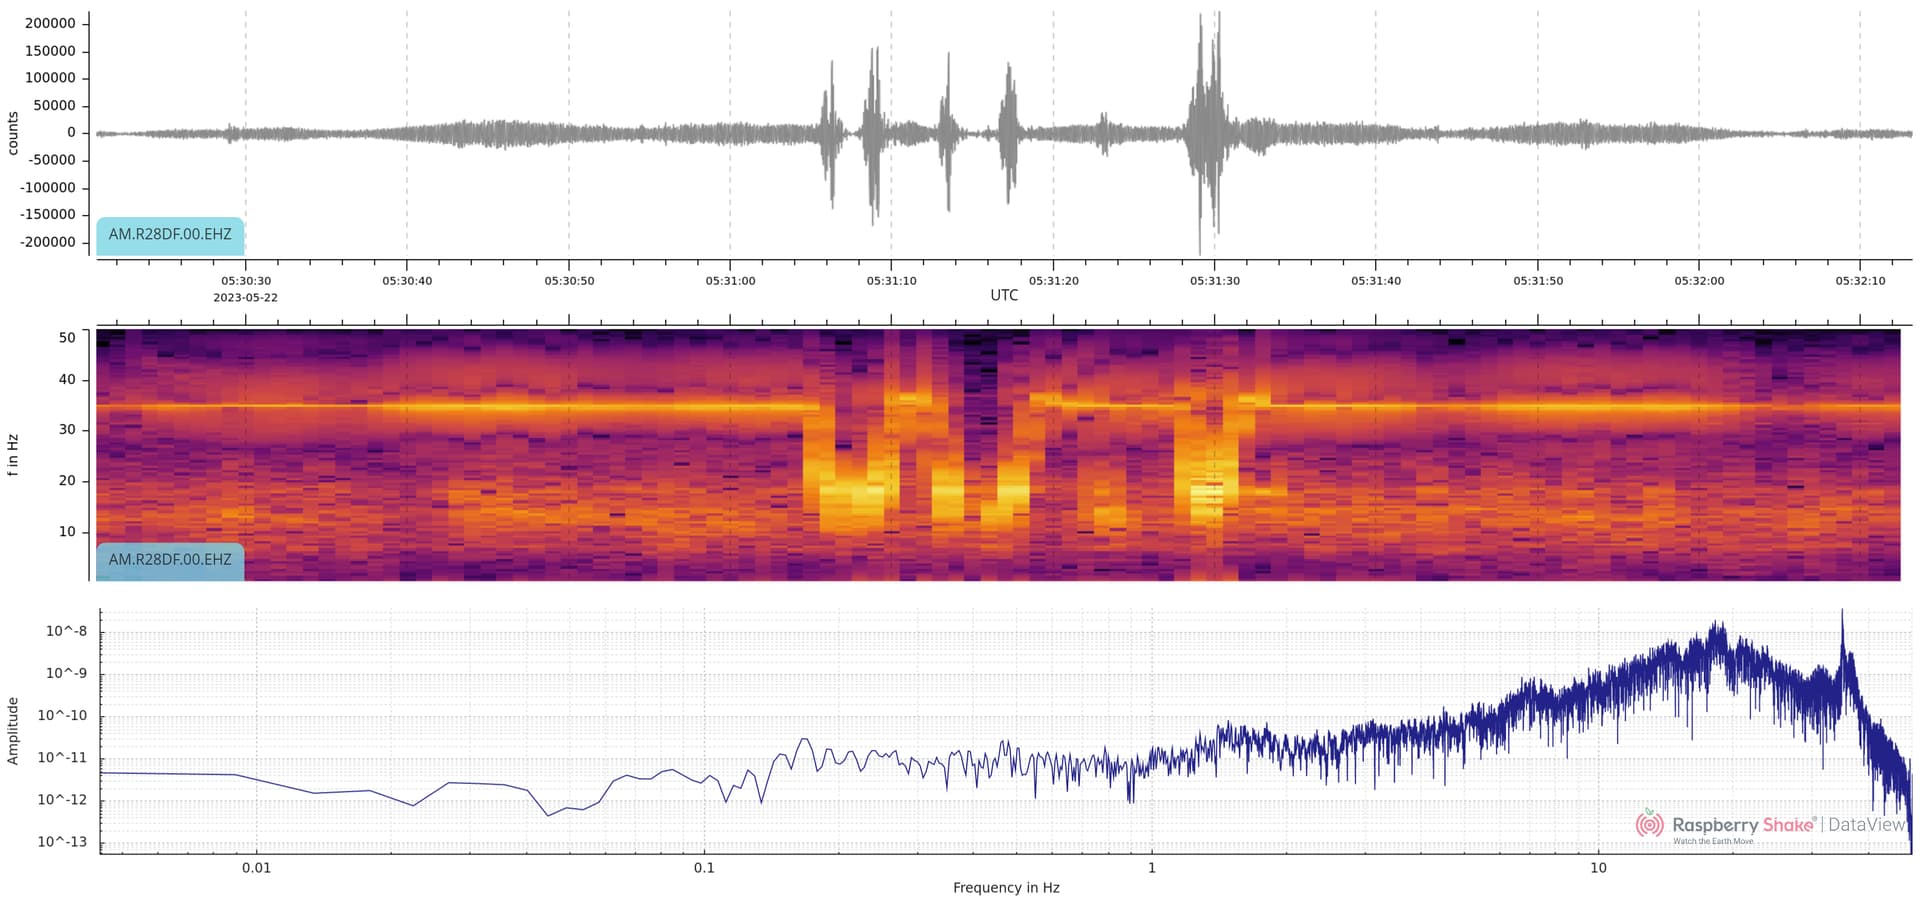
I don’t know why SWARM is producing such unrealistic high values, but the ones from DataView are the correct ones.
In the track you have posted, the maximum value seems to be around 6E-4 m/s, so 0.0006 m/s, or 0.6 mm/s. In terms of maximum displacement (ground motion), you should be around 5E-6 m, so 0.005 mm.
It is a concrete possibility, SWARM is no longer maintained by the USGS, so some of its functions could not work properly as the did in the past.