I have only had my shake/boom running for a few days, so these questions may be just part of a learning curve that I haven’t reached yet.
Background:
My device is resting on a large concrete slab - the floor/foundation of a barn (inside the barn). It is not as perfect a location as I had hoped, but probably as good as I am going to get. You can see on the helicorder plot of the EHZ channel a distinct diurnal pattern. Fairly quiet at night, but it gets a bit noisier during daylight hours. We are 150m or so altitude, on the side of a hill, overlooking the local town and a fairly busy highway, about a mile away. Also a fair number of small planes and helicopters from time to time.
The real questions:
I saw a new Boom come online today, in France, not far from where I used to live. Out of interest I took a look at the live stream from it, and was struck by the difference to mine. Now, I know that this location in France is quiet countryside, so quiet is ok, but it did raise come questions in my mind about my stream.
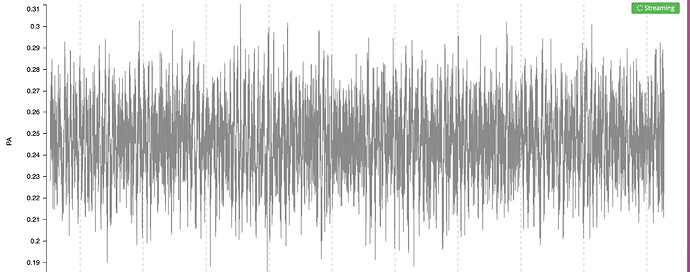
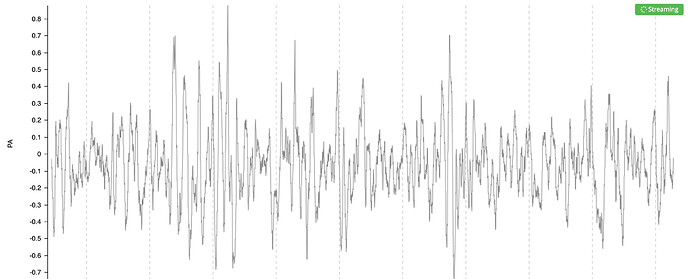
The French stream (R9BD8) is centered on zero PA in the livestream. Mine is centered on 0.24 PA, and it doesn’t seem to vary from that. Looking around other devices, I see similar offsets. Any suggestions as to what accounts for this?
My (boom) trace R309F:
French Boom:
1 Like
Hello PhilipPeake,
Yes, I have the same situation with my instruments. They are in the less noisier place in my house, but they still “feel” the daily cycle of vans/buses/cars/doors/washing machines/etc. Luckily, most of the local noise can be filtered out when examining the recorded data, so it’s still possible to acquire good traces even in noisier locations.
And, sometimes, the noise is even more important than the actual data!
But I digress, and I want to thank you for bringing out this discrepancy in the live stream Shake display. I have opened a ticket for our software team. They will take a look at what is causing the issue (which is present for some other Shakes too) and solve it.
It is, likely, caused by a non-uniform standardisation of the data display, which will be the element that has to be corrected.
Thank you again!
I do see some interesting stuff already. I thought this might be of interest to people here:
On Saturday we went shopping. When we returned I noticed a big event on the Z channel, took a look at it and then saw the same on the infrasound channel:
Whatever it was made a noise and shook the ground … now what do we know that does that? Well at least round here its usually a helicopter flying directly over the house. The frequency plot pretty much confirms it:
The frequency shift in the upper line when interpreted as a doppler shift gives a speed of around 128mph, so almost certainly a helicopter.
Been having discussions with people that know more than I do about helicopters as to why there are three lines on the frequency plot – the same is visible looking at the Z channel data.
2 Likes
The weather warmed up a bit here (Oregon), so decided to mow the lawn before the next batch of cold rain arrives. The lawn mower is in the pole barn, in front of my tractor, so I had to take the tractor out to be able to take the lawn mower out.
My SB is sitting on the concrete floor of the barn - a 30x60 feet slab of concrete.
I expected to pick up sound from the tractor, but was surprised at how much vibration carried through the concrete … or maybe I might say how sensitive the device is to that vibration.
Here is the infrasound. Starting the tractor, backing it out and leaving it idling:
and this is the Z channel:
3 Likes


