Hello Shake community - we are new users who wanted to test the capability of the Raspberry Shake 3D to measure the natural frequencies of vibration of rock arches here in Utah. We’ve been making these measurements for several years now, but always using a Trillium Compact / Centaur setup from Nanometrics. While that setup is amazing, it’s expensive, so we thought to test a Shake in the application. University of Utah undergraduate student researcher Clayton Russel made it happen.
Short of it is, it works! With some small caveats but overall very successful, which is encouraging to support widespread low-cost resonance measurements and monitoring of geological as well as civil features. Rock arches generally have clear resonant modes but low vibration amplitudes, so capturing the ambient resonant frequencies is a challenging measurement for any system.
Below is a link to the report, including direct comparison plots between the Shake 3D and Trillium Compact, and at the end a link to download all raw data if you’re keen to test it for yourself - geohazards.earth.utah.edu/images/UROP_Final_Report_CR.pdf
6 Likes
Beautiful work Clayton and Jeff! Thank you for sharing!
Hi Jeff!
I am Bambang Setiawan from Aceh, Indonesia. I just bought Raspberry Shake 3D a week ago. I want to use this seismometer for measuring the site natural frequency, also. Do you use Windows Operating System for communicating with the seismometer? If so, can you share the manual for instrument setting and data collection, please?
Thank you very much.
1 Like
Hi Bambang,
I use windows, yes, and access the shake using both command prompt and the web browswer, and use filezilla to download data. It took me some time to learn about how to set up the instrument for unsupervised use in the field (and with the GPS antenna), and I created a field manual to help me and my students perform basic ambient vibration data collection. In case it helps, I’m happy to share it…Raspberry Shake Field Operating Instructions.docx (18.6 KB)
Good luck! Jeff
1 Like
Hi @JeffMoore, awesome work!.
I was wondering if you could help me to understand the report’s appendix 2 images. I suppose you transformed velocity series to acceleration through numerical integration, but I don’t get it why you obtain so high levels of matching between PSD velocity spectra but it can’t be observe in PSD acceleration spectra. I was in shock when I saw for the first time the PSD velocity spectra because they’re so close to Peterson’s NLNM curve in some parts (140dB-160dB), but i don’t know,
Thanks in advance,
Regards,
Korrozivelab
1 Like
Hi Korrozivelab,
Yes, in appendix 2 the data have been transformed to acceleration, the full instrument response has been applied for each sensor (rather than just the scalar conversion factor as in the other plots), and the data have been rotated into the direction of the arch span. The latter might create some more apparent differences, as e.g. some arches have very little ‘radial’ component motion (HNR). Overall I think the match is reasonably similar to the previous velocity plots - compare e.g. Figure 5 and Figure A3 - the main resonant frequencies are clear and match well esp. on the horizontal components. For me these appendix plots really highlight the higher noise floor of the RS as compared to the TC… which is expected and also visible in the velocity spectra. The really great match we shown in Figure 2 is for a pedestrian bridge that vibrates like crazy - note the difference in power scale for Fig 2 vs Fig 3. Thanks for reading, hope that helps!
Best, Jeff
2 Likes
Dear @JeffMoore
Thanks for your reply, it helps me a lot. I’m not used to work with PSD in dB scale ,so maybe it is a reason to misunderstand your findings. I would like to practice in this topic but my RS3D is on its way, so I don’t have rough field data to work. I’d downloaded the report’s raw data from supplementary material but I’ve realized the files units are displayed as counts. I would really like to learn from this study case, so Prof Moore I was wondering if could obtain the response xml files of both instruments?
Thank you so much,
Regards.
Hi! So first advice I would give is that you don’t need the entire instrument response file to play with our data - you can just use the scalar counts -> velocity conversion factors that are given in the report and be in good shape.
Otherwise, the RS3D IR files can be found here: https://manual.raspberryshake.org/metadata.html#raspberry-shake-rs3d
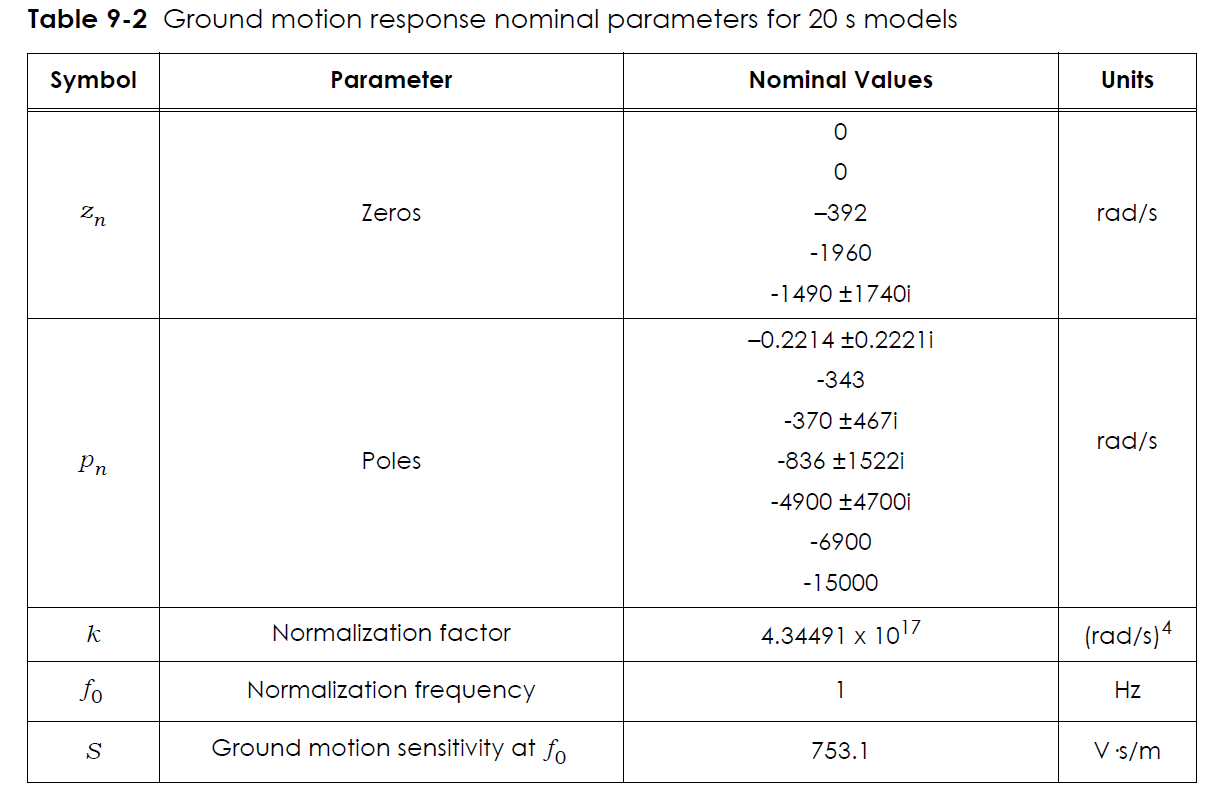
For the Trillium Compact 20s, you can find information for the pole-zero file on IRIS: http://ds.iris.edu/NRL/sensors/nanometrics/ or I copied here the text from our pz file (we don’t have an xml version of this sorry) converting to velocity:
ZEROS 6
0.0 0.0
0.0 0.0
-392.0 0.0
-1960.0 0.0
-1490.0 1740.0
-1490.0 -1740.0
POLES 11
-0.2214 0.2221
-0.2214 -0.2221
-343.0 0.0
-370.0 467.0
-370.0 -467.0
-836.0 1522.0
-836.0 -1522.0
-4900.0 4700.0
-4900.0 -4700.0
-6900.0 0.0
-15000.0 0.0
CONSTANT 1.30886e27
also here: https://geohazards.earth.utah.edu/images/Compact20s.png
Hope that helps, good luck!
1 Like
Professor Moore
Thank you very much for your help (and patience too!). I finally understood that PSD velocity and PSD acc are not the same despite both being expressed as decibels. I had a good day reading this work!. I didn’t have idea that a new Global Noise Model was published!!. Also I found very exciting the related paper about sparse measurements for dynamic characterization of rock arcs.
I’m waiting to know any update of these works!.
Regards!
2 Likes
Hi Professor Moore,
I very much appreciate you sharing your study methods, results, and instrument setup procedure. I am planning a short-term remote deployment similar to yours, so this information is very helpful - thank you!
I am new to the raspberry shake, but I have the impression that the RS is very sensitive to the power supply (i.e., exactly 5 V). Do you mind sharing specific product information for the power bank/battery you used in your experiments, in addition to the general description in your paper of “12 AH lithium-ion battery”.
Sincerely,
Mike
p.s. I realize its been several years… so apologies in advance.
1 Like
Hello mdupuis, and welcome to our community!
Bumping this up and tagging Professor Moore @JeffMoore!
Also, there are a bit more details on off-grid and battery-powered installations on this page of our manual that you may find useful: Solar Power Recommendations
Sure thing Mike, happy to help. It has indeed been quite a few years but I was able to look up what I purchased and it was this rather inexpensive power bank:
I then just had to make up a cable to go from the USB output to the Raspberry Shake, splicing to the supplied power cord. It was here that I noticed the sensitivity to input voltage you point out. The first cable I made used a cheap USB cable, and the instrument would not power on. After that I replaced it with a higher amperage USB cable and had no issues. Usually these higher ones are rated for 3A. Hope that helps. Feel free to ask any other questions!
2 Likes