I am trying to access RS data using ObsPy code that I have been using for a long time, and which has been working fine for a long time, and I’m getting this error message:
FDSNException: No FDSN services could be discovered at ‘https://fdsnws.raspberryshakedata.com’. This could be due to a temporary service outage or an invalid FDSN service address.
Below is the code that I am using. Any suggestions?
Thanks!
from obspy.clients.fdsn import Client
from obspy import UTCDateTime
start=“2021-08-14 12:32:00”
stop=“2021-08-14 12:37:00”
starttime = UTCDateTime(start)
endtime = UTCDateTime(stop)
Our team is still investigating https://fdsnws.raspberryshakedata.com/ and its associated issues, which many users have reported. Therefore, this address remains unavailable for now. We apologize for any inconvenience.
In the overall server-side work we have been doing, we recommend switching to the following FDSNWS address: client = Client(base_url='https://data.raspberryshake.org'), which will provide the same service as the previous address.
Also, if the data you are trying to retrieve is from 2021, this year is not yet available in our new data server, as we are still working on synchronizing legacy data files. As the current limit is February 8th, 2024 (Live Data Issues - #54), your query will likely return empty for now.
That works. But, after running it in ObsPy a few times, it stops working, and I get a similar message (see below).
I tried restarting ObsPy, and I could sometimes get it to work, and sometimes not ???
This might be an ObsPy issue (and/or my limited ObsPy coding skills ), and I will keep experimenting, but let me know if you have any suggestions.
Error Message:
FDSNException: No FDSN services could be discovered at ‘https://data.raspberryshake.org’. This could be due to a temporary service outage or an invalid FDSN service address.
I have passed the information to our team so that they can check what exactly is going on with this intermittent error you are seeing. Your ObsPy code is more than fine, so there may be something on our side.
Have you tried/has it happened again during the weekend, to your knowledge?
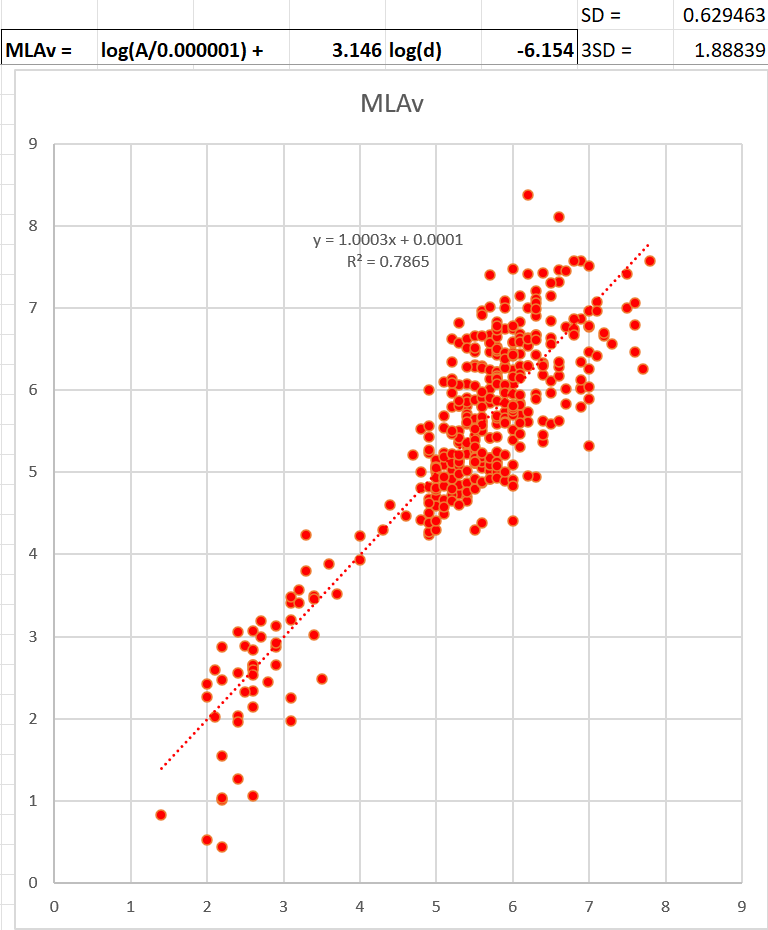
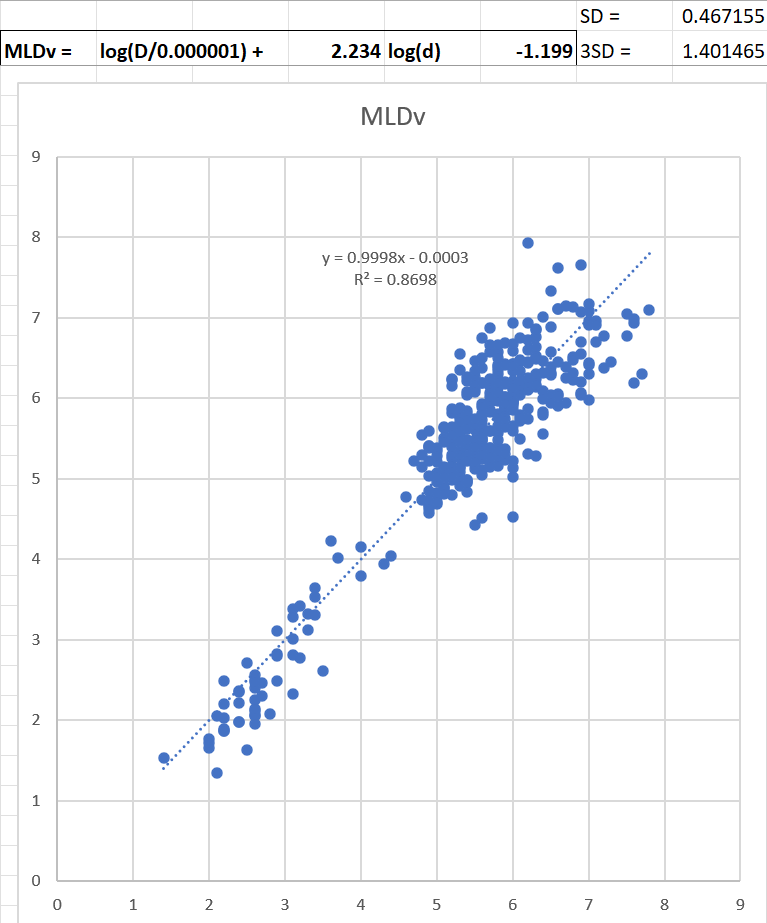
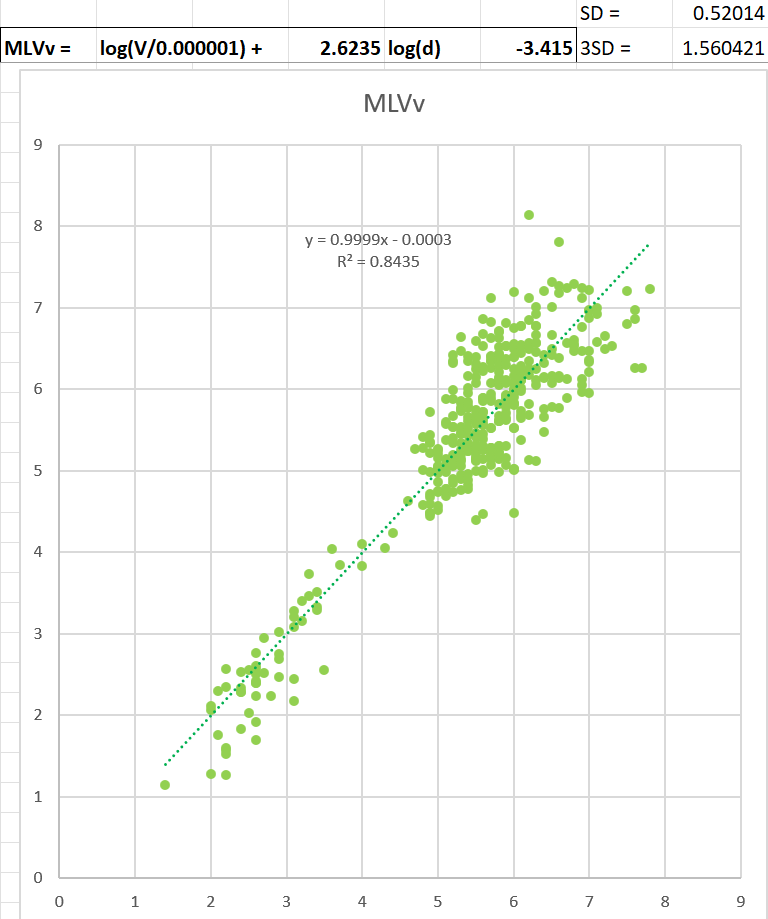
As you can see the best my method can achieve is +/-1.4 magnitudes for MLDv, with MLVv and MLAv less accurate due to the increased influence of the higher frequencies.
So with errors like +/-1.4 magnitudes, I’m interested in what you are doing to achieve +/-0.1.
Question: I wasn’t sure what the axes are in the attached figures. It looks to me like it’s one type of magnitude vs another type of magnitude. Am I right about that?
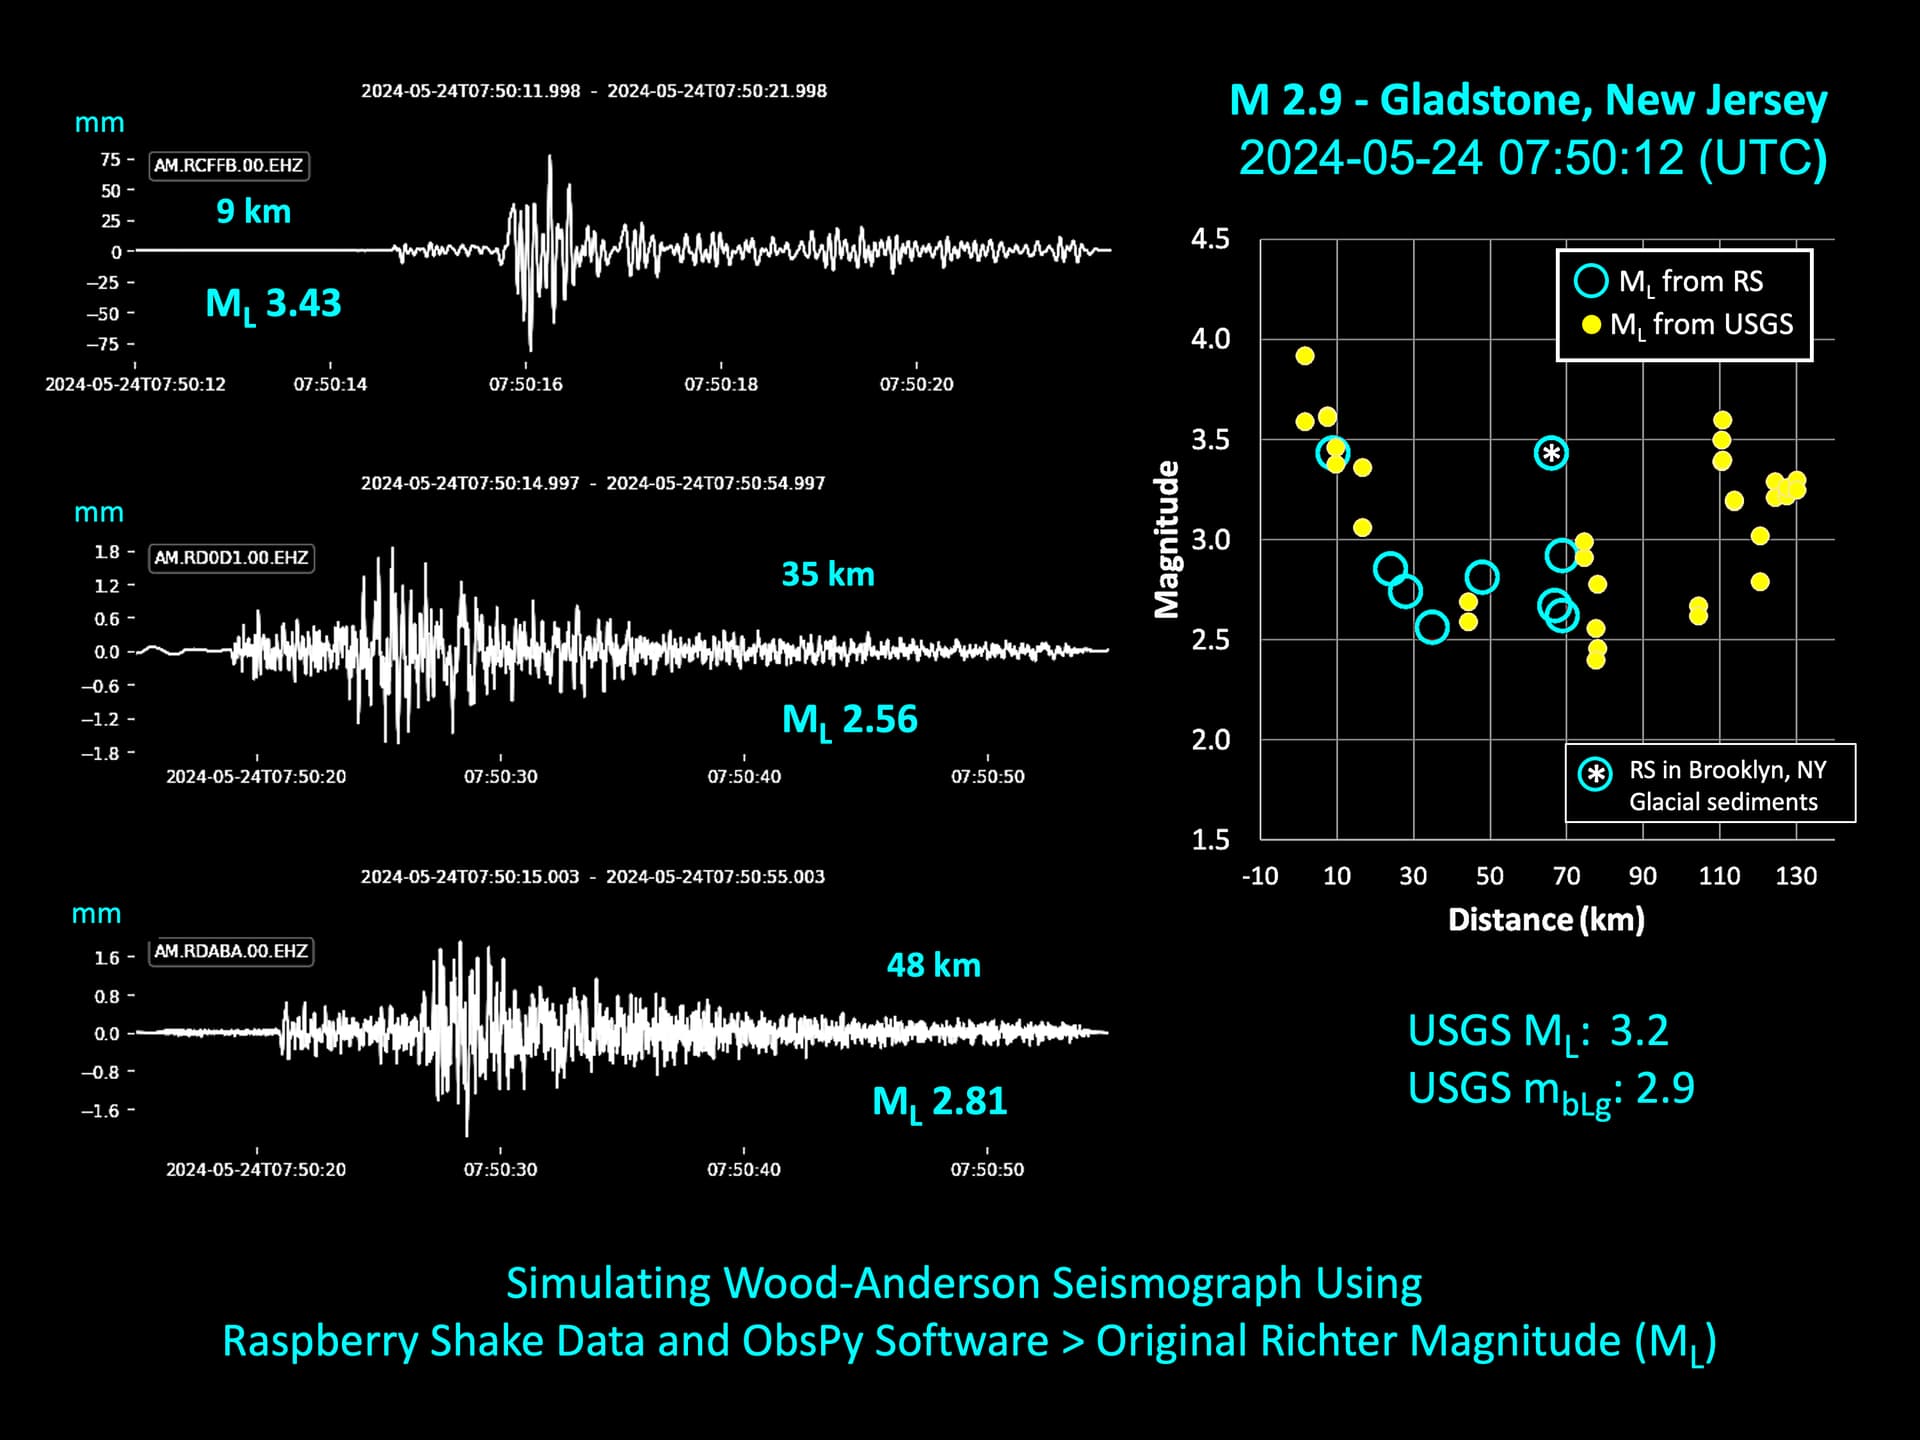
What I am showing is the same type of magnitude (ML) estimated from stations at different distances. So, my full range of differences is about 4.0-2.4 = 1.6, which gives an error of +/-0.8 (comparable the errors you see). Also, mine are done a short distances in a localized area, so crustal structure difference corrections are probably not as much as when magnitude is determined from larger distances.
What I’m trying to do here is to see if I can track down what is causing those +/-0.8 differences In this very localized case - and it seems like distance might be the source of a lot of the effect.
If this isn’t clear, that’s because it’s late at night for me - I will return to this in the morning.
Correct, I am plotting the calculated (estimated) magnitude on the y axis against the published magnitude on the x axis.
I don’t know if this observation will help you with what you’re trying to do or not, but I have noticed directional variation in the minimum magnitude my station can detect. My hypothesis is that seismic signals are not transmitted well ACROSS major faults. For example, it’s very rare to detect a quake smaller than M5 from New Zealand unless it is very deep. Vanuatu, Fiji and Tonga are further away than NZ but I can detect smaller quakes because they are on the same side of the major fault line as I am.
Similarly, quakes from Papua New Guinea, are undetectable below M5, yet I can still detect quakes at M5 from Taiwan and Japan and even the South Sandwich Islands (because I think the ray paths from these quakes are passing through the mantle under the major crustal faults).
So if you’re trying to find why there’s variation from station to station from an ideal magnitude distance relationship, one thing I’d be looking for is the location and size any faults. No doubt different rock types may have different rates of transmission and attenuation as well, but that’s way more technical than I can comment on!
Either way some geological survey maps of the area you’re studying should show the rock types and fault lines.
Interesting observations. In Cornwall, UK, we also detect small earthquakes (M4.6+) from Vanuatu, Fiji and Tonga, but don’t detect similar magnitude earthquakes from the Mediterranean or relatively close parts of the Mid Atlantic Ridge. Fault orientation and direction of fault movement have to be factors, orientation of the wave movement being detected by a vertical geophone is important as the Vanuatu P-waves arrive vertically. Also Lay and Wallace discuss Q, the quality factor from p109 in their book. High quality factor = low attenuation. Q for P-waves in shale and sandstone is 30 and 58, for peridotite in the lower mantle it is 1200 and in the outer core 8000. So waves passing through shallow crustal rocks suffer a lot of attenuation, but those passing through the mantle from deep earthquakes far less. On p283 they show a section of a subduction zone with varying Q. I tried uploading a pdf of the pages, but it failed. However, horizontal and vertical changes in Q are shown to affect attenuation in this text book. I will try to share this with you on another platform.