No seisms on my shake

You sent me previously a clip from my shake in order to show that my device was working OK. The y axis units are M/S. A friend in the UK also sent me a clip, and his y axis units were also M/S. What does that stand for, and where are you two sourcing this display? I look mostly at the helicorder display on Swarm, and the y axis units there are Counts. Should I be looking somewhere else?

He also advised me to filter the raw waveform, to cut out high frequency noise. I can’t find out where to do this in Swarm waveview settings.

I have the app up and running but would like to filter out everything less than ML2. I can’t see where to do that. I looked in settings, there doesn’t seem to be anywhere to do that.

I notice that when I select a quake on the app, and then click on it to get the wave display, there is a lag between the time on the x axis of the display and the time at or near epicentre. Is the display time on the app RS’s best guess as to when the quake would have arrived at my shake?

Essentailly, I’m trying to identify quakes that I have been notified either on the app or the USGS emails (Mag 5 or greater), but n ot succeeding. I’d appreciate any help you can give me, please.

Pretty much every seismometer uses transducers that are essentially analog devices - they generate a voltage proportional to how far they move. This is converted to a digital value by an analog to digital converter. The digital value is the “counts” value that you see on Swarm. The actual values usually have an offset from zero, so Swarm (and most other display software) takes an average value and adds/subtracts as appropriate to “zero” the display around a zero axis.

Each seismometer has calibration data to allow conversion of “counts” to actual physical measurements - how far is it moving, and how fast (meters per second).

Swarm doesn’t know how to pull the calibration data for RaspberryShake devices (as far as I know), so just displays the displacement in counts.

You don’t necessarily need to be looking elsewhere, but the RS DataView web page is worth a look:

https://dataview.raspberryshake.org/

That system knows how to pull the calibration data for each device, so converts the counts values to meters and meters/second.

Both the DataViews web page and Swarm support filtering of the data.
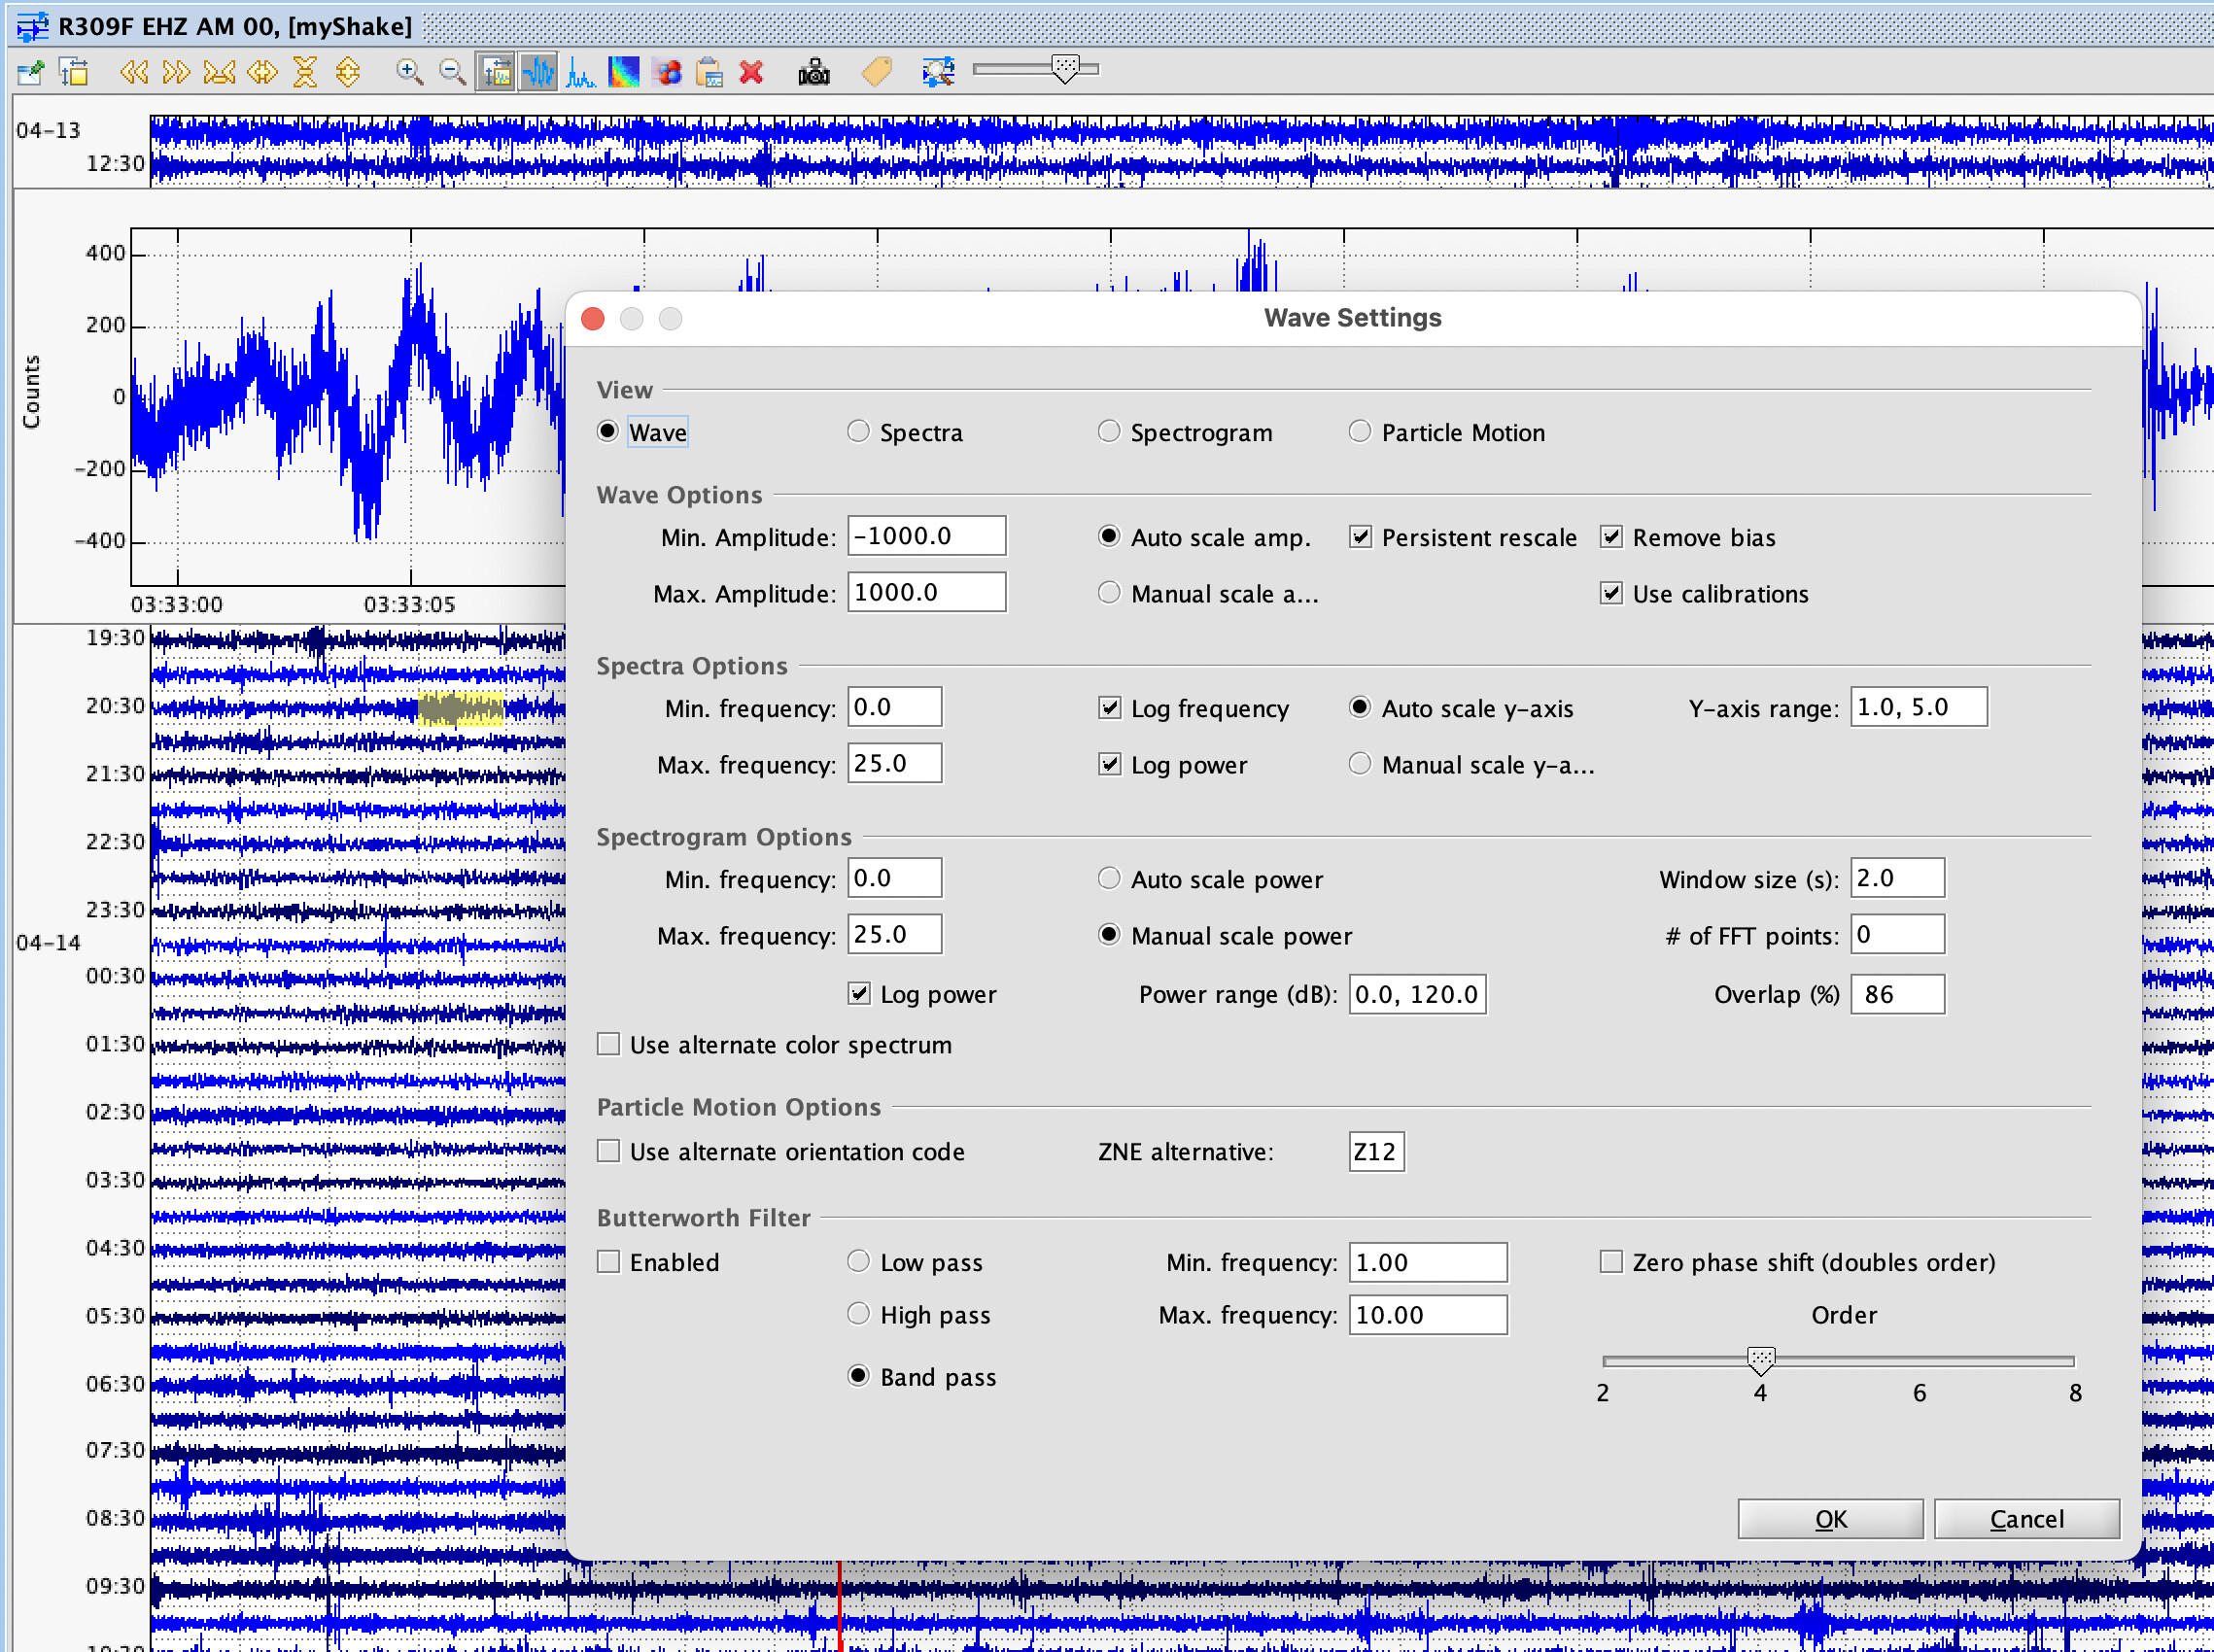
For Swarm, next to the magnifying glass (minus) and the “waveform” box is one for “Wave Settings”.
One of those settings is for a Butterworth band-pass filter:

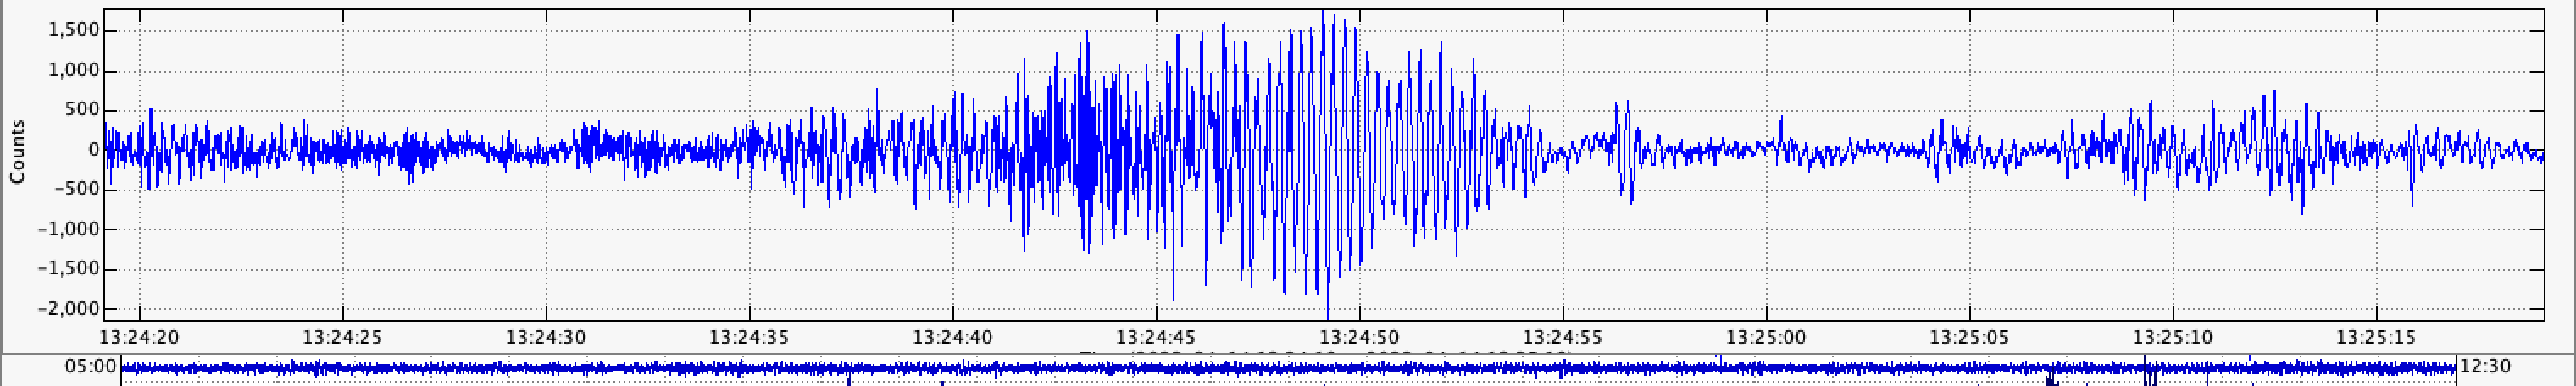
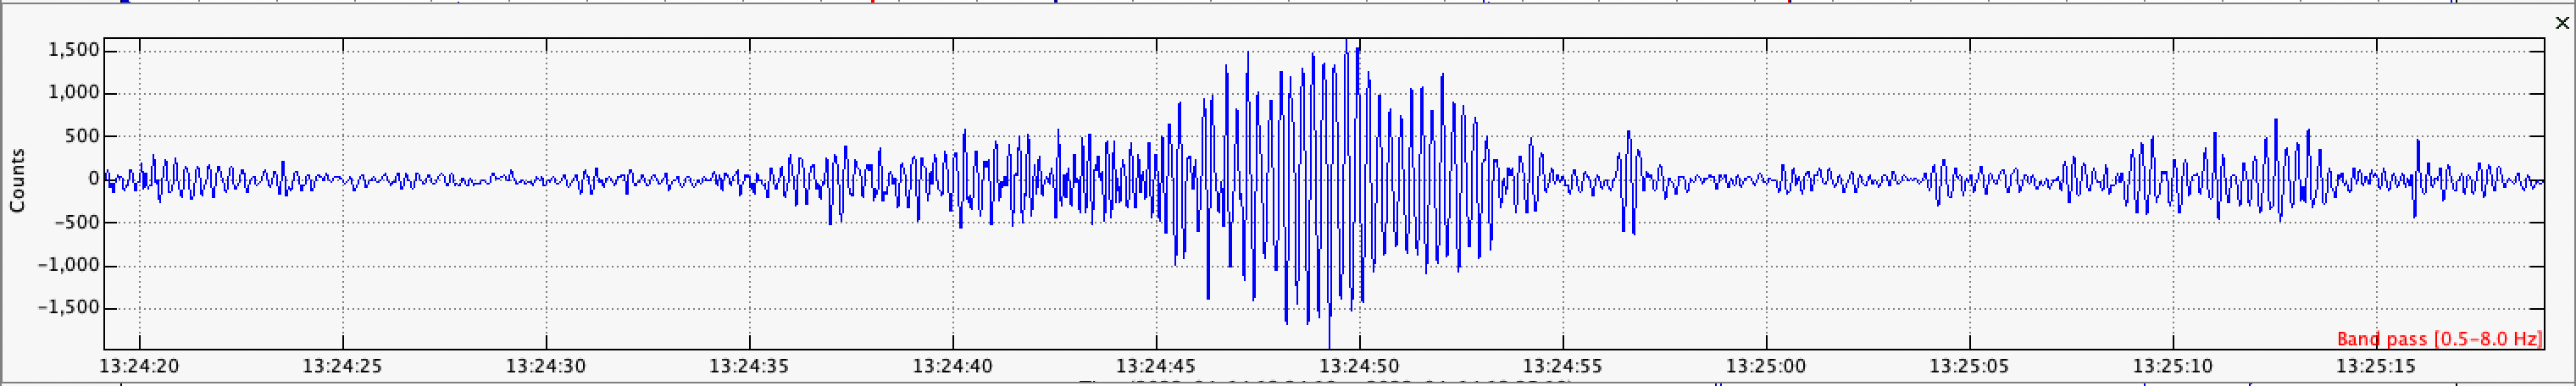
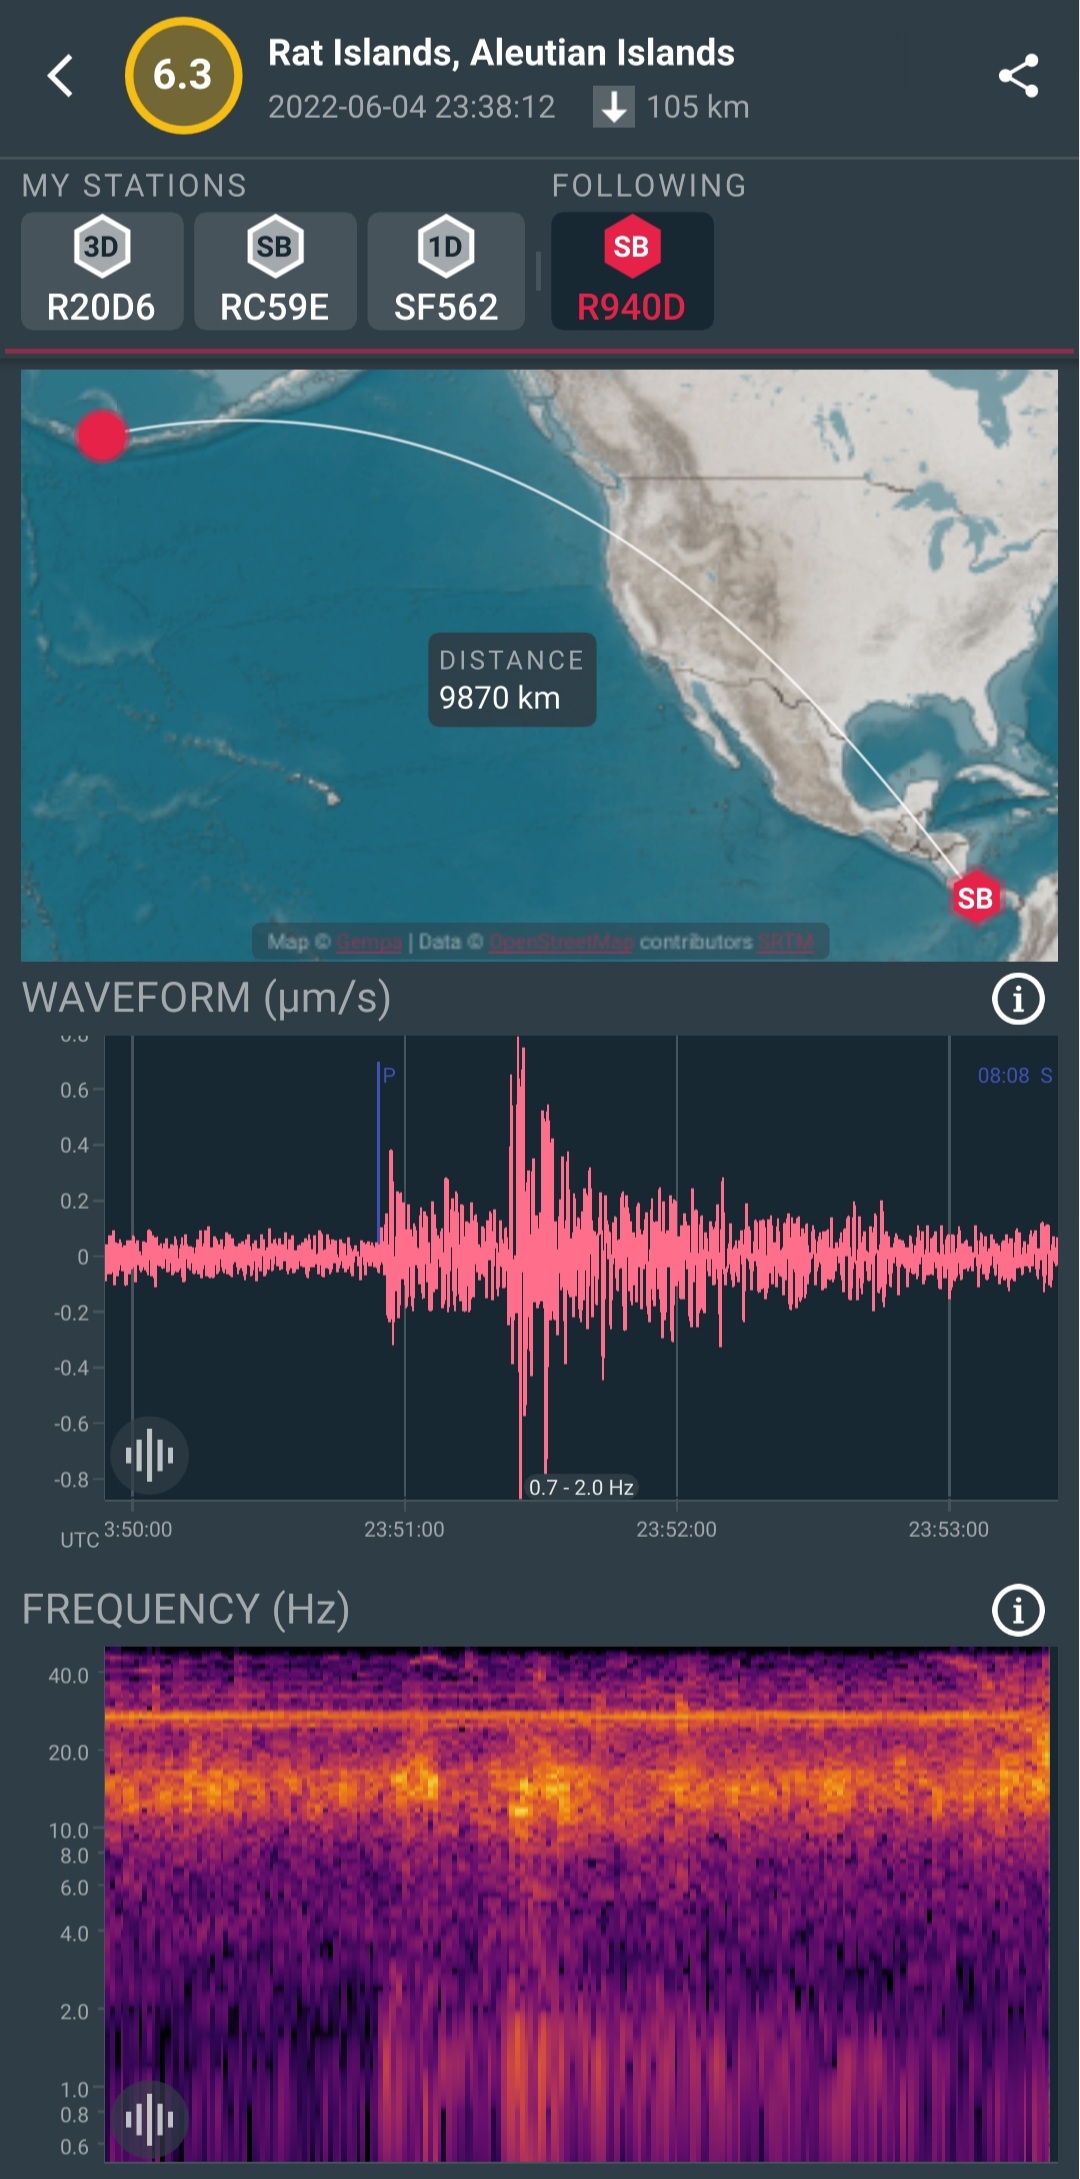
At the bottom of the pop-up box. As an example of what it does, here is the same waveform without and with a filter enabled.


You can choose different filters on the app too.

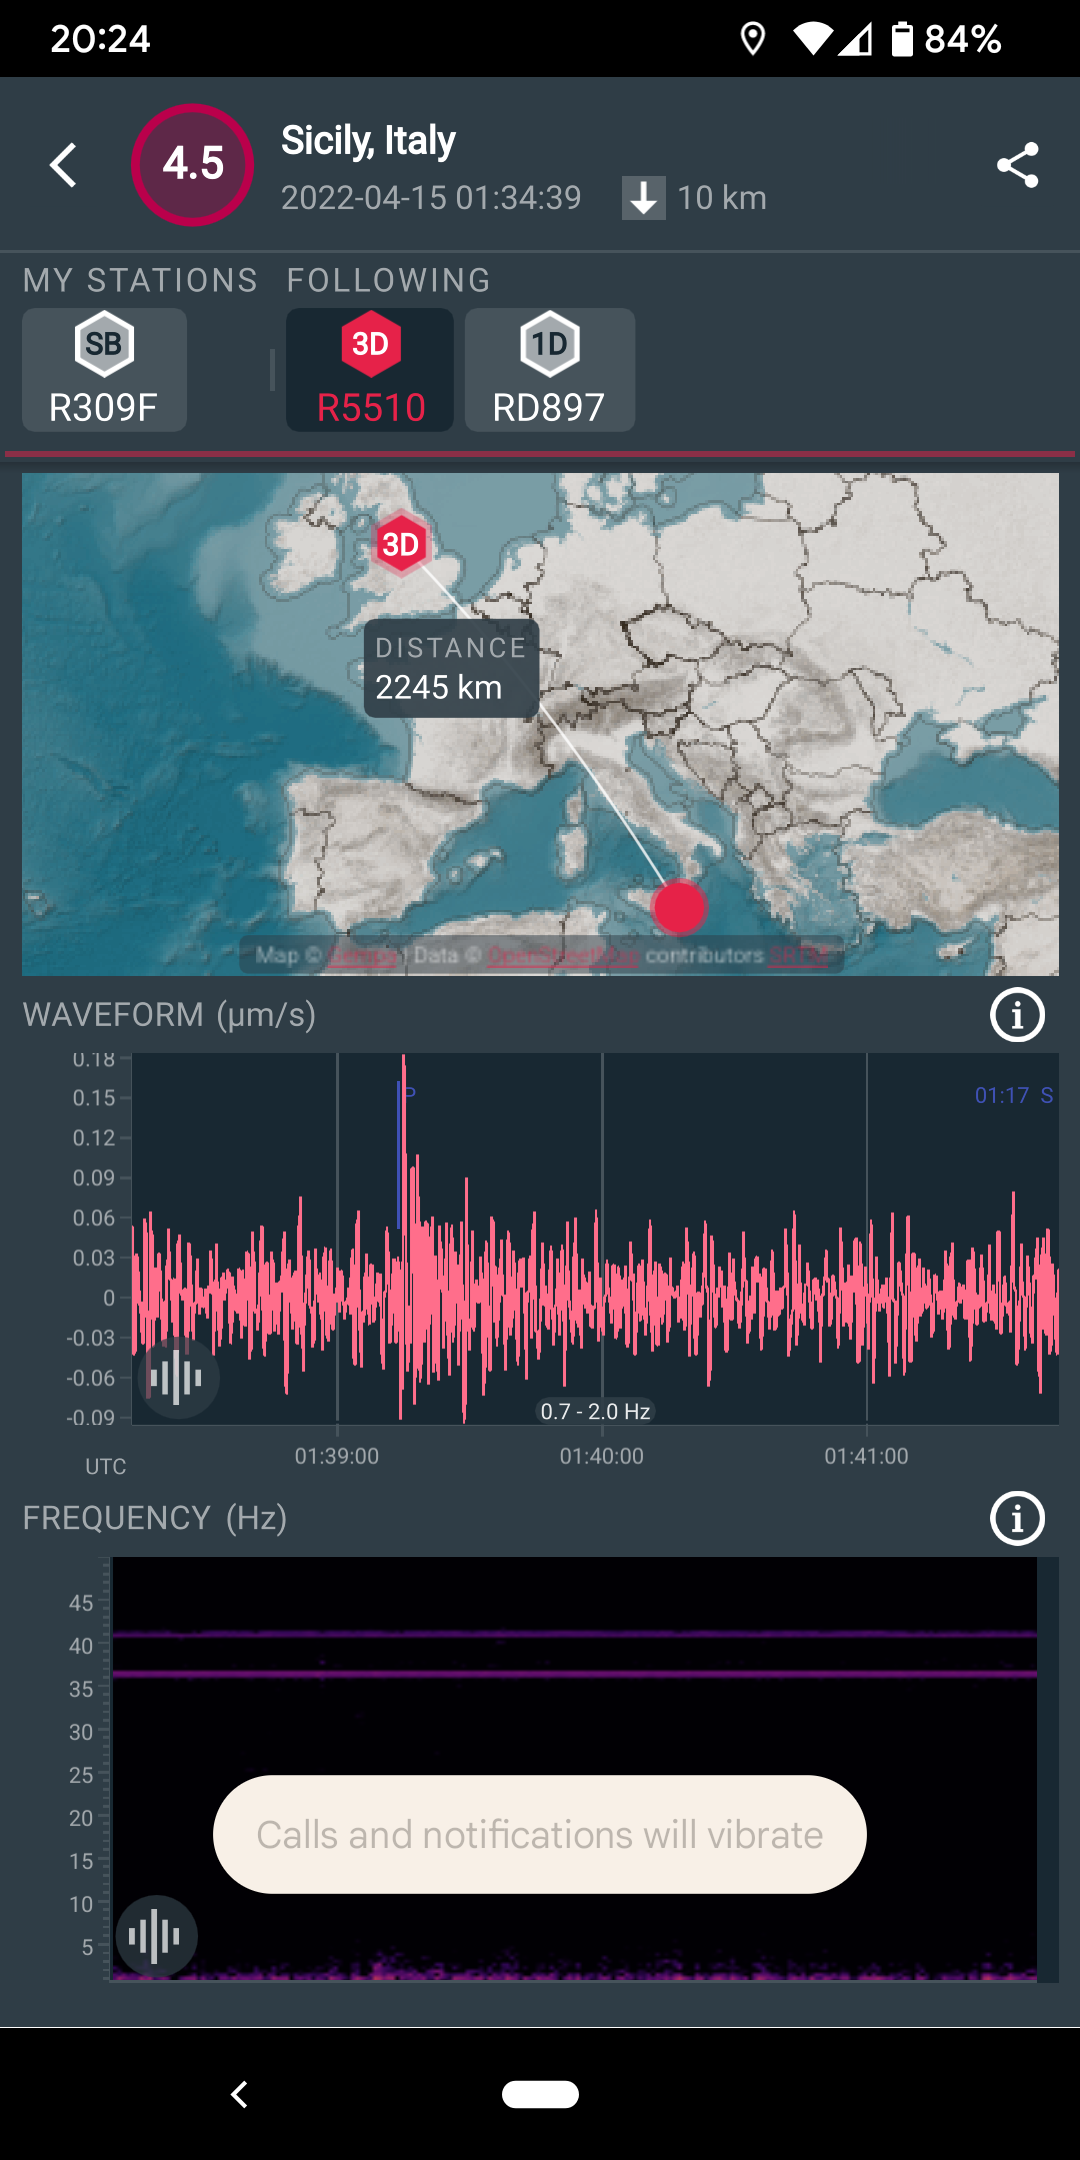
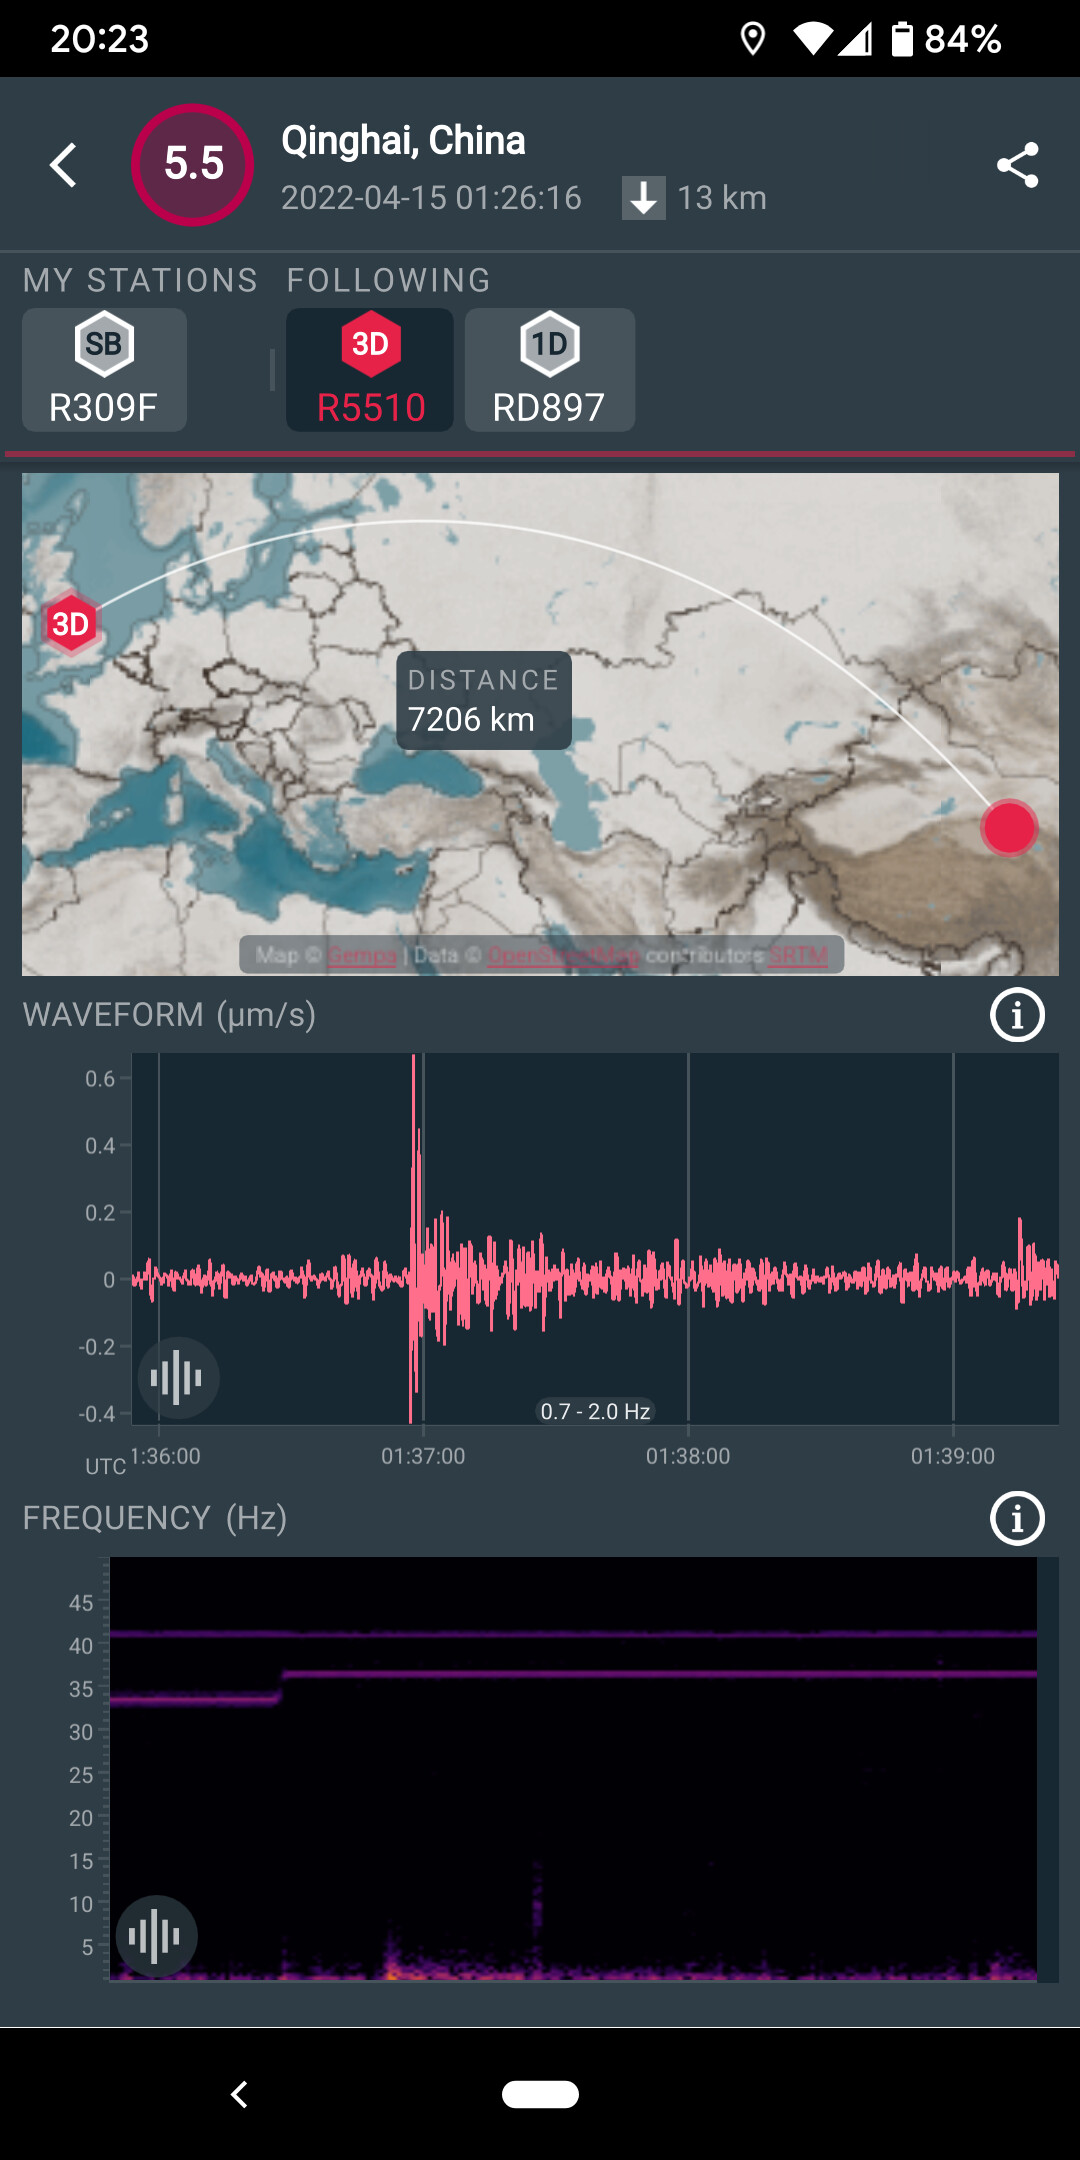
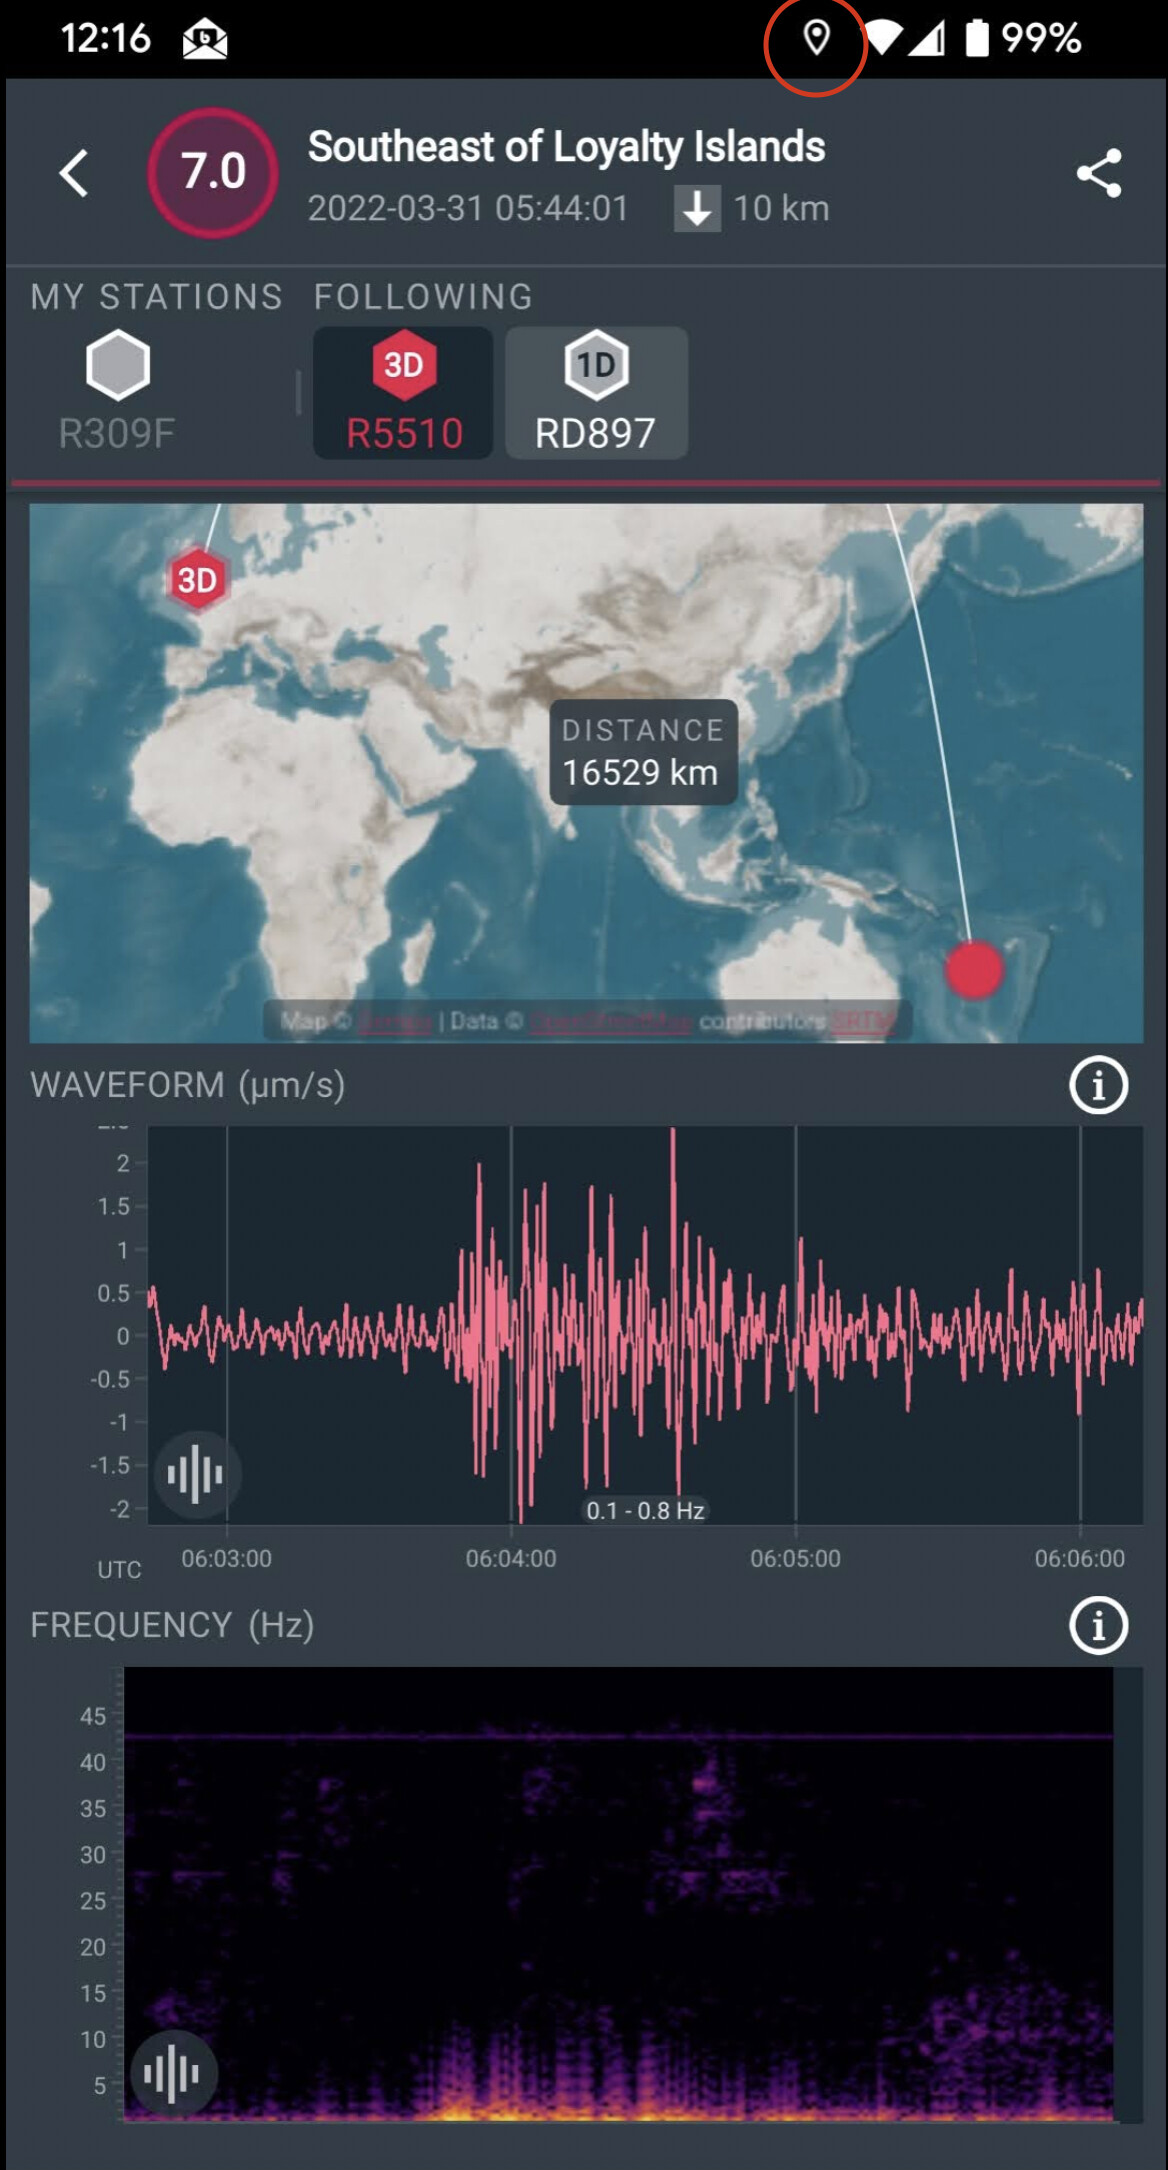
As for seeing the different 'quakes … even at M5, it needs to be fairly close in most cases.
I did look at your data to see if I could see the two events (Atlantic and Poland) I mentioned before, but they don’t show. I get the same problem here. Some are clear as day, others just … nothing.

Also, there are a couple of other devices within 20 miles or so of me. Looking at those as well as mine, some 'quakes show up on one, two, all or none. That is why you need so many devices spread over a wide area to pick up all events.

As a general guide, if you can’t see an event on the mobile app looking at your device data, you are going to be VERY lucky to pull anything out with other filter values - not impossible, but not likely.

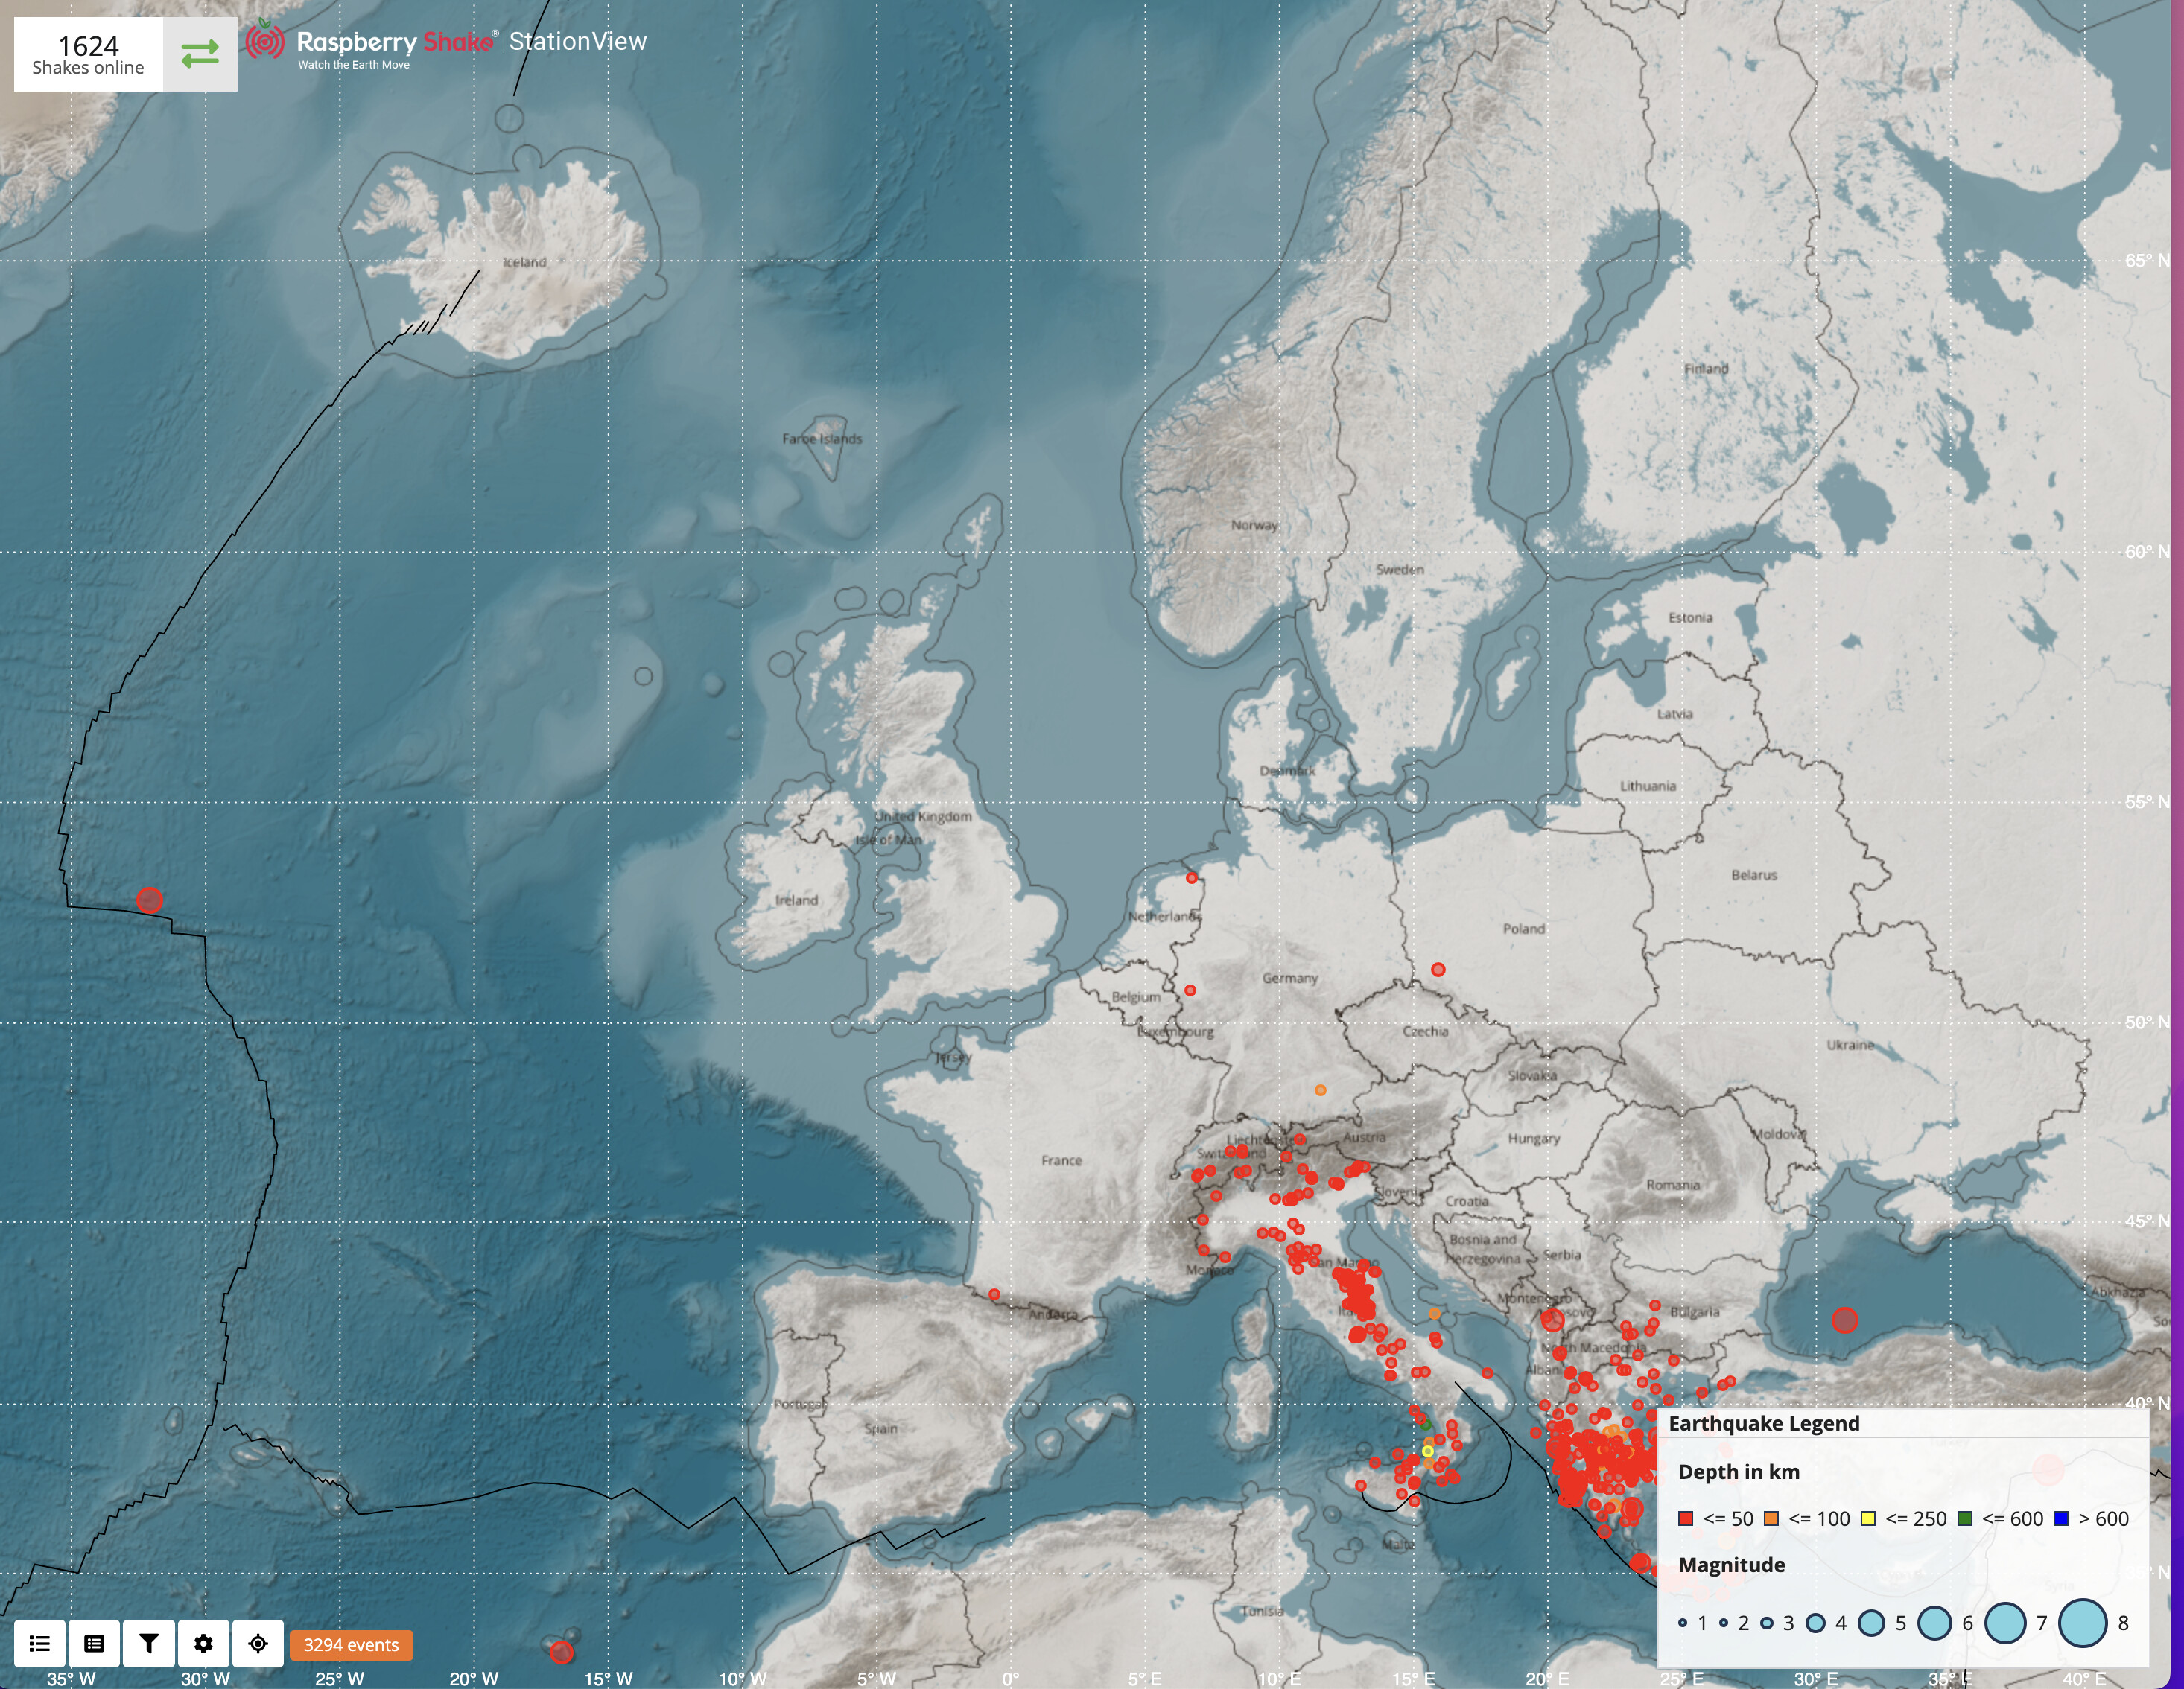
Unfortunately, England is not geologically active. The only “earthquakes” I remember being related to collapsing coal mine workings. Of course, there is always a good chance of picking stuff up from Iceland!

Edit: Checking how quiet it is … unless you live in Italy!

Looks like you have picked up a couple:

2 Likes

I’ve checked the app, and yes, there they are. However, when I look for them on the helicorder display on Swarm, there’s nothing at those times. I changed the filters to 2.0 - 8.0 and then 0.2 - 2.0, but still nothing. Why is that?

I tried opening the RS DataView page but it was just blank.

OK, problem solved, I think. I was looking for the Qinghai and Sicily on the helicorder display at the time of the quakes at epicentre, whereas I should have been looking at the time on the x axis of the clips. That was just my lack of familiarity with how to use the data, though it seems obvious now. Anyway, I found the events on the helicorder display, with a c. 644" and 276" time lag respectively, which seems fast for China at 11.2 km/s but OK for Sicily at 8.1 km/s. I’ll keep a close eye on the app and follow up any likely cadidates. I’ll let you know what I find! Thanks again for your time and help.

Hello Chaps - I have a couple of observations and questions: on my ShakeNet app, the wave display has a thin blue line with a blue P next to it, is that the interpreted P wave arrival at my shake? And to the right of those, there is a Blue S and some figures, is that the interpreted delta t between the P and S waves at my shake in minutes and secs? Suspecting it is, I’ve compared it to the theoretical delta t from graphs of P and S arrival times I’ve downloaded from the net, and sometimes it’s spot on, sometimes it’s not, so what is it and how is it derived? If that is indeed a P-S delta t, is the discrepancy between it and the theoretical value from a chart possibly due to mantle isotropy?

All the best,

Pete

Pete Webb
Cell: +44.7815 133695
Skype: pete.webb38

1 Like

Hello Pete,

Yes, the two P and S lines/phase names indeed represent the arrival times of the same phases at your location for the selected earthquake.

There’s a lot of possible different factors that could have contributed to the discrepancies you are seeing between your signal times and the theoretical timings. Installation position, location, type of material upon where the Shake is positioned, soil type and density, depth to bedrock, structural footing and attachment to bedrock, bedrock type, etc.

The model used in the App should be the iasp91 one, if I remember correctly, which is a reference model is a parameterised velocity model that has been constructed to be a summary of the travel time characteristics of the main seismic phases.

One additional question: When I run the app, I notice that it runs “location” pretty much constantly, which makes me wonder if the P-S wave calculation is based upon the selected station location, or the location of the phone?

These will probably be fairly close in most instances, but not always.

I am guessing that it is the station location?
I have seen the sort of discrepancy that Pete mentions, but put it down to the fact that these are models, and have to provide answers pretty quickly, so are likely somewhat simplified, and thus sometimes a bit less accurate.

I’m not sure, Philip. what you mean by “location”. When I run the ShakeNet app, there isn’t a “location” on it or at least, I haven’t seen one. There’s a distance, but that isn’t constant for earthquakes in the same region. Intuitively, I feel the distance, and/or location, would relate to the station, not the phone.

Pete Webb
Cell: +44.7815 133695
Skype: pete.webb38

I was talking about an indicator on Android - it has two levels of precision for finding the location of the phone. One is based upon IP address, Cell tower info etc. Not super precise, but good enough for most applications. However, apps have the option of requesting a more precise location, by turning on GPS. That takes a lot more battery power, and you have the option of allowing it to be used or not, either globally, or on a per-app basis. When it is enabled, and invoked by the app there is a little indicator - top of the screen, circled in red.

Id it is not being used, why would they use it? Note that in this case, I have your device selected, and there are no P-S wave indicators – my guess is that they were calculated for my (phone) location and so are well off that display??

Hello Philip, Pete,

Regarding your location ID queries, the app uses the phone location to calculate the distances that you can see in the list of earthquakes in the events tab. In this way, wherever the device is in the world, the user will always be able to find the closest earthquakes to his position.

The P and S timings, however, are calculated between the event and the selected station. For example, if I select the strong M6.3 in the Aleutinian Islands of some days ago, and then a Shake in Panama, the P-wave time is calculated based on these two locations, as the image below shows.