Thank you for sharing this @kpjamro.
I have been seeing a lot of “cultural” noise posts on social media lately. Here is a sampling:
- Cultural noise posts by Shaker @jordi:
- Cultural noise posts by Shaker @wmvanstone:
- Cultural noise posts by Shaker @kafka:
- Cultural noise posts by Shaker @austinjelliott:
- Cultural noise posts by Shaker @pjkoelemeijer:
- Cultural noise posts by Shaker @seismorost:
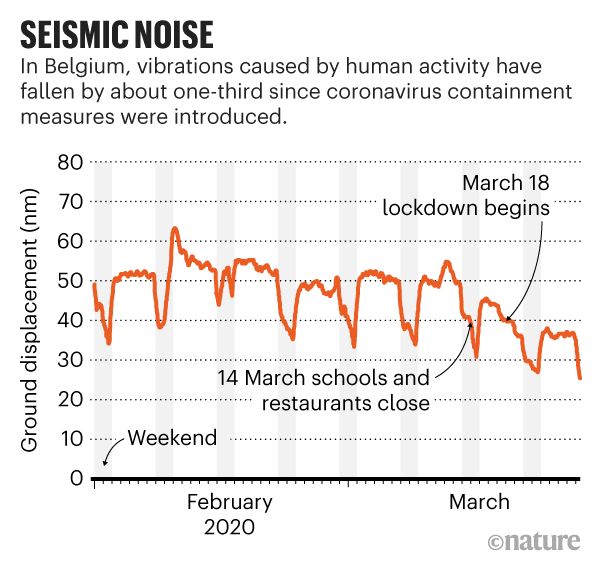
- A scientific article published in Nature featuring Shaker Emily Wolen:
- Even more cultural noise posts:
(*) Many of these plots are being generated using code written by Thomas Lecocq.
We also posted a cultural noise plot today: https://twitter.com/raspishake/status/1245076461817643008 using his code. I retweet everything I come across at https://twitter.com/raspishake.
If you are interested in learning more about cultural noise, see here for a peer-reviewed publication entitled “Seismometers Within Cities: A Tool to Connect Earth Sciences and Society” by Barcelona Shakers @jordi and @mario. This one of the many peer-reviewed publications that have come out in the scientific community recently that use data from the Raspberry Shake network. For other publications, see: https://raspberryshake.org/news/peer-reviews/.
from quarantine, branden
Ambient seismic noise recorded by a RaspberryShake in our office in Boquete, Panama over the last three weeks. The effects of Social Distancing measures at work! Based on code written by Thomas Lecocq.
from panama, branden & ian
My response to this is less about seismic noise and more about this community. It has been incredible over the last three months to get to know the list of people whose work Branden has just shared and some others. When a friend forwarded a link to the Nature article to me today, it was brilliant to be able to say I had been helped by several of those mentioned and to be able to point the friend to graphs produced from Thomas’s noise code and also from Emily’s Rayleigh Wave plotting code from February. Thomas and Emily have been very generous with their time and willingness to share their work, I have benefitted massively from them, I really appreciate their willingness to help, with patience and real grace. I could not have been happier to see their names in this news item from Nature and to be part of this community. So thank you for what continues to be an amazing journey.
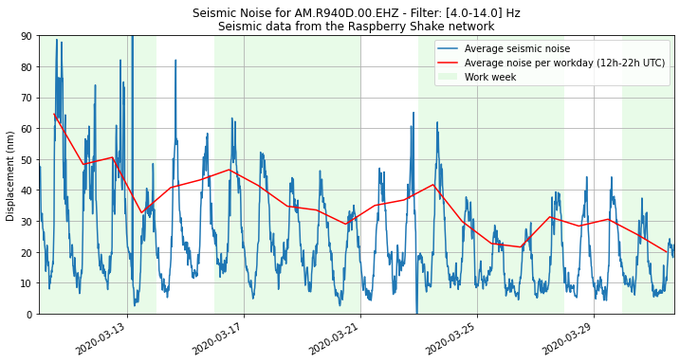
And, so you can see that we have continued with our social distancing measures, here is the 4-14Hz range for the whole of March from R7FA5 in Truro. Having worked up through the seismic wavefield these last few months, my latest discussion on Twitter has been about the frequency of our central heating pump, which is right at the top of the Raspberry Shake’s range at about 45Hz, but which was switched off following the school closure. Thanks again.

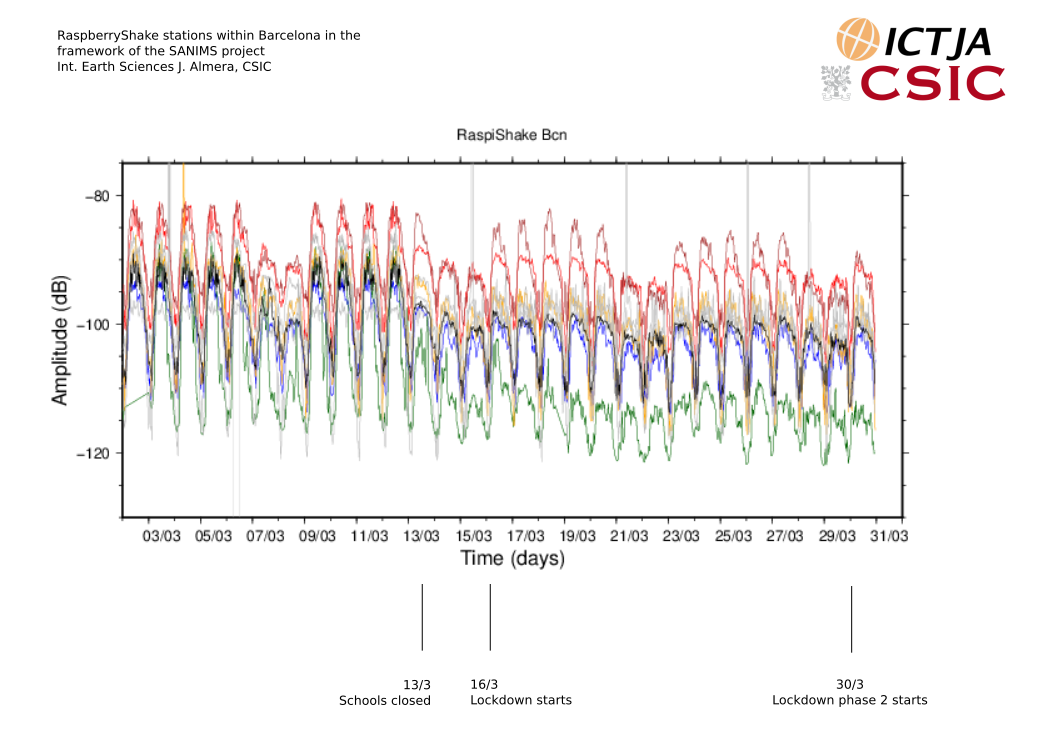
Here and update of the noise variations at the RaspberryShake stations installed in secondary schools within Barcelona. The different lockdown phases can be clearly seen!
Here is an article published in the Atlantic that references a Raspberry Shake:
Thanks for the lead @pjkoelemeijer!
Branden
And another in CNN!
branden
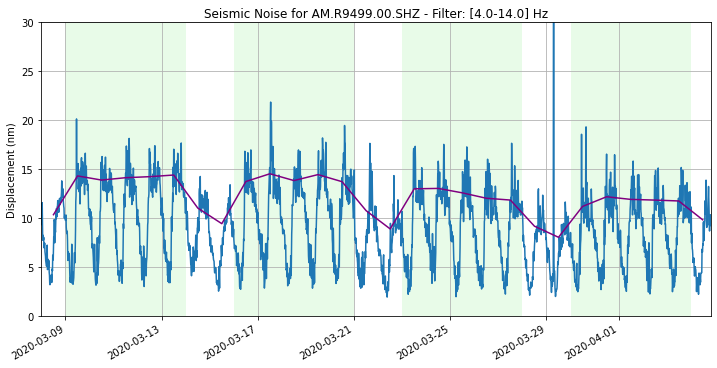
…and another Seismic Noise plot, this time from Montréal, QC, Canada. Schools closed on March 13th, bars, gyms, and pools on March 15th, and all non-essential businesses on March 21. I live in a noisy part of town, and the busses, trains, and delivery vehicles are still runnning. The spike on March 29th was a local magnitude 3.1 earthquake. The average is from 6am to 4pm (11:00-21:00 UTC)
each day.
Hi.
I’d love to run the numbers on my Southern California shake (I can clearly see the change), but just keep hitting brick walls with this project.
There is no ‘how-to’ for the myBinder version and I get pages of errors when trying to install the conda version.
Have spent more than a few hours on trying to generate the graph.
Any pointers would be much appreciated.
I’ve never used myBinder but several people on here have gotten the Jupyter version to work. Do you mind posting some errors for us to work out?
Both the native Python/Jupyter notebook version and the myBinder web browser wrapper have worked well -the code is a bit picky with respect to formats.
On Thomas Lecocq’s github page there’s a link to the myBinder version (same as Branden’s link above): GitHub - ThomasLecocq/SeismoRMS: A simple Jupyter Notebook example for getting the RMS of a seismic signal (from PSDs)
use the TruroSocialDistancing.ipynb Notebook as it’s set up for Raspberry Shakes.
For example, here’s the call for the Montreal RS R9499:
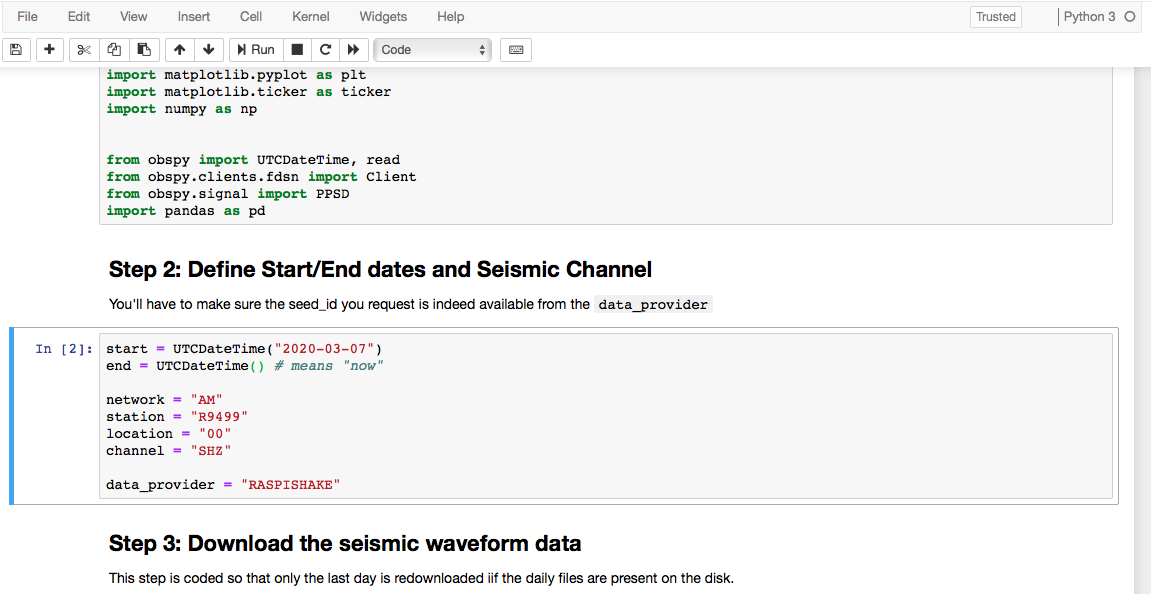
You’ll need to click run for each step (current step has the blue bar) and wait for the code to finish running (small filled circle in upper right, or hourglass in the myBinder version). Many days worth of miniSeed files will take some time to download.
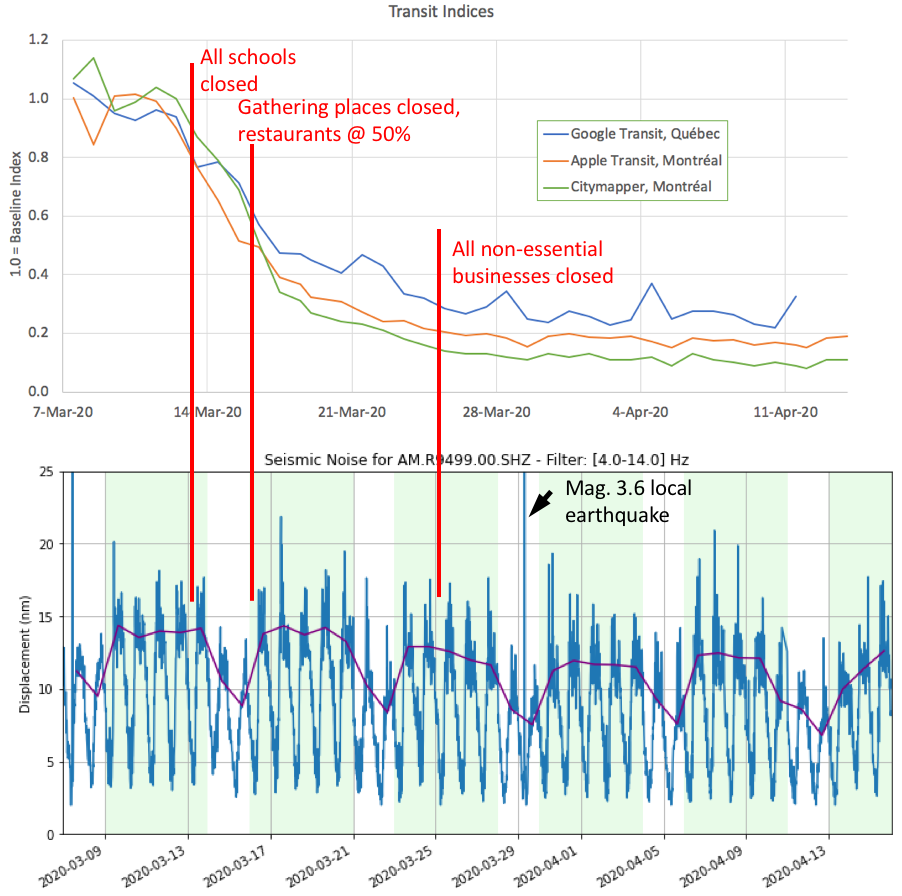
Below is a comparison of mobile phone-based measures of activity (the transit Mobility indices of Google, Apple, and Citymapper) with the average seismic noise (daytime, 4-14 Hz). The Mobility indices drop as soon as public schools are closed and then public gathering spots (pools, gyms, etc) are closed, but there’s no real reduction in seismic noise until there’s a general closure of most all businesses. I’ve used the Montréal R9499 Raspberry Shake. Note that April 10 (Friday) and April 13 (Monday) are civic holidays this year in Québec.
Apple Mobility trends: https://www.apple.com/covid19/mobility
Citymapper: Citymapper Mobility Index | Citymapper
Google Community Mobility Report: https://www.google.com/covid19/mobility
Thanks for the sanity check that the myBinder should work. (And that the raw code is the harder way to do it).
I may have been using the wrong myBinder, will try with the one you mentioned.
EDIT. The key is two fold, first, run the correct myBinder and second is not to accept the default date.
All this time I have just been trying to run with the date as per the myBinder and its been failing to pull the data and throwing a lot of errors.
Once I set the date to 2020-03-07 the data is pulled down and the process runs without any errors.
Unfortunately, there is a glitch somewhere in my station data and here is the graph that is produced.
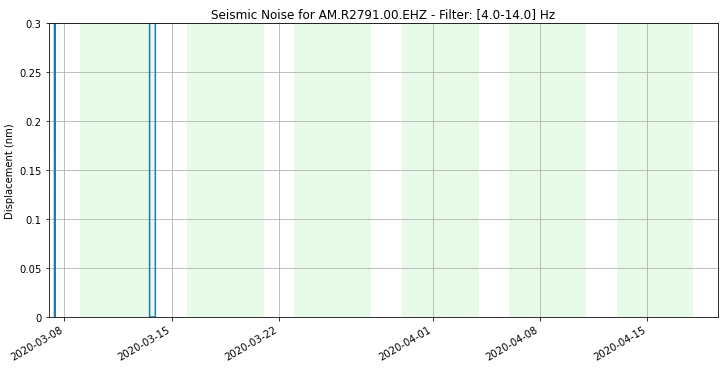
Thanks all for your help. It was worth a go and I am just happy to get it to run without an error.
You’re almost there! Notice the y-axis scale: 0.3 nm (nanometers; billions of a meter). This scale is appropriate for quiet areas, not urban ones. The only data that shows on your plot are two dropouts with no data (0 displacement).
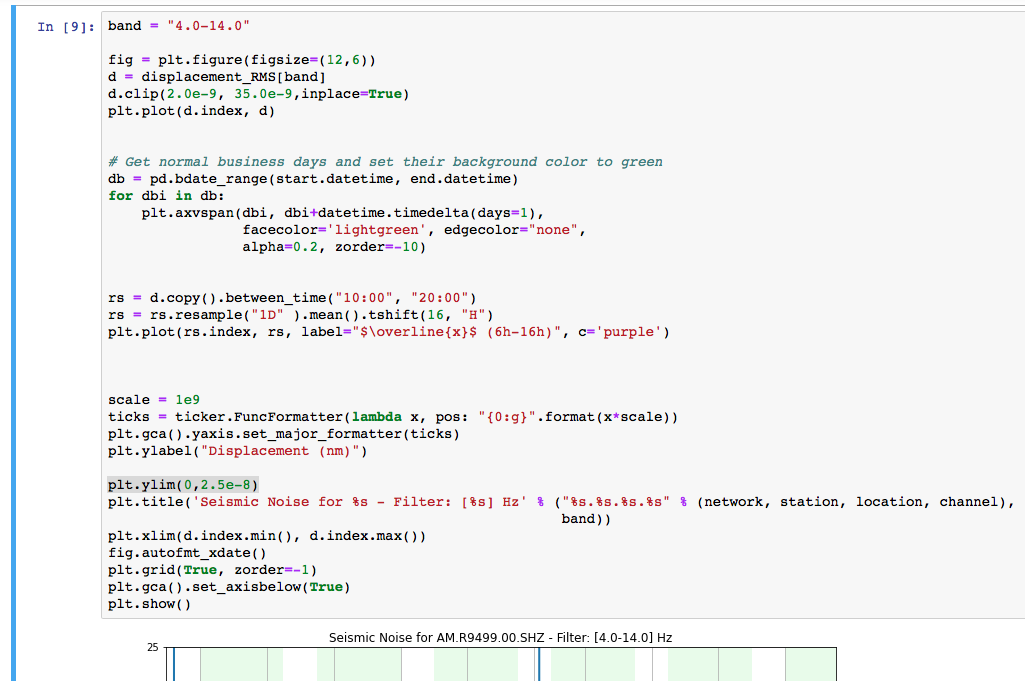
The line highlighted in grey shows the y-axis plot limits, lower and upper. I’ve set mine to 25 nm, but you may have to go higher.
I’ve made two other changes as well:
- I’ve shifted the averaging by four hours (UTC+4) for my timezone:
(where ‘rs’ is defined and resampled) - I’ve added a filter at the top
(d.clip)
to raise the floor of data dropouts, and to clip high amplitude signals (the RS is in my basement).
Thanks so much for your help! That setting is the key to seeing some data on the final graph.
Unfortunately there is a problem with my station data and I cant go back to before the lockdown date and so my graph is essentially flat.
Here is what the error looks like;
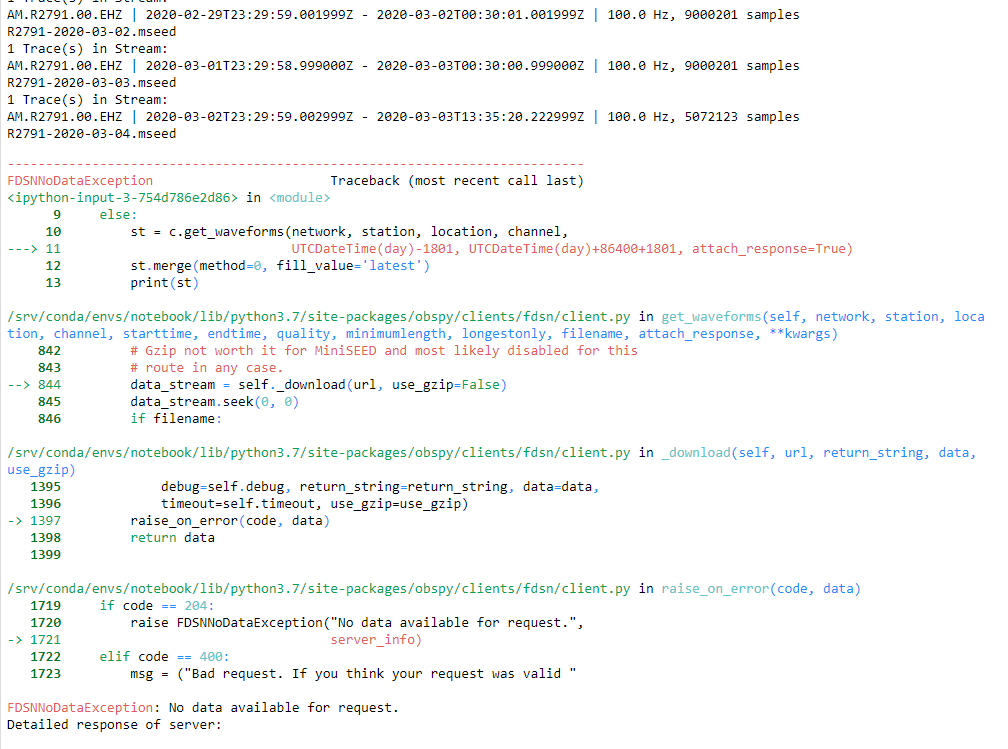
I suppose I could try and gather data after this date (using it as the starting date). Might be worth a try.
It takes a good while to attempt each run as you have to shutdown and restart the myBinder each time otherwise it caches the program run results.
Looks like some of the data from that date range isn’t stored on the OSOP servers. It might still be on your Raspberry Pi if you’ve increased the local storage time to 50 days or more…
The Raspberry Shake R25AC in Vancouver shows a fantastic drop in urban noise (4-14 Hz) coincident withe social distancing measures:
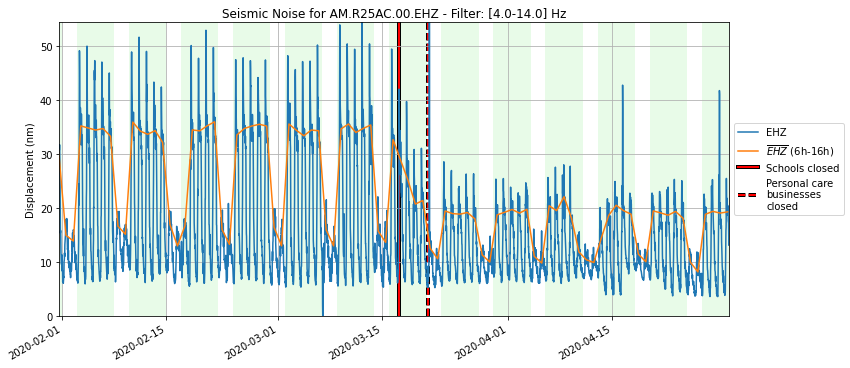
The Raspberryshake.net map puts this Shake at Canada Place in downtown Vancouver; would the owner be able to add any more information on the location or the installation?