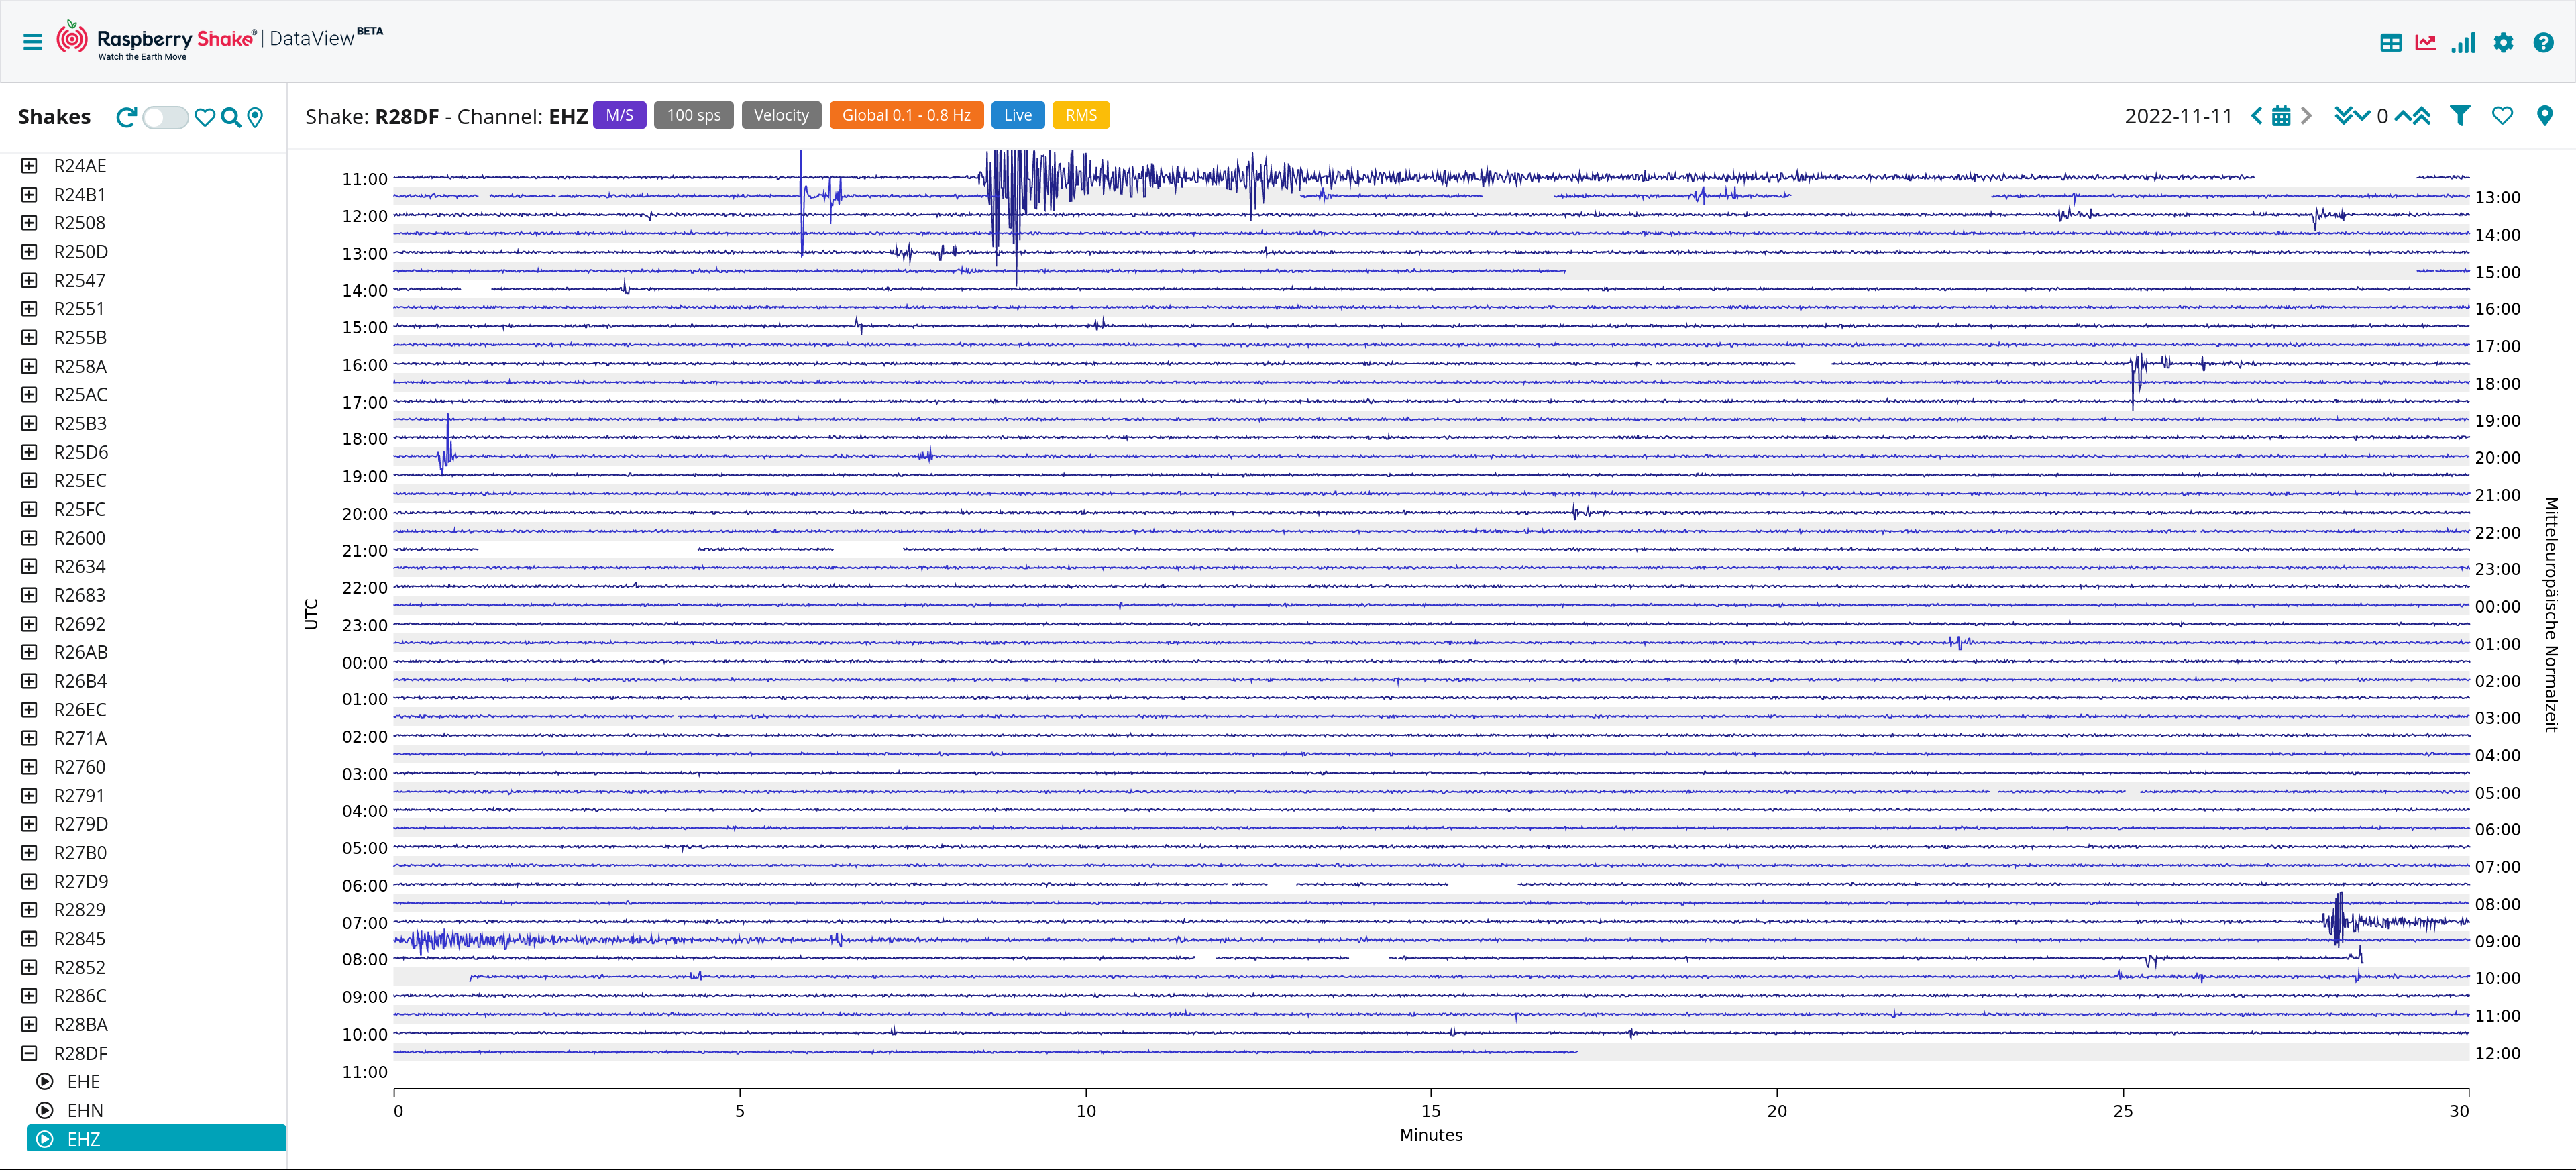
My wife is using data from the ShakeNet for an earth sciences project, and she has a couple of questions about the earthquake markers on the RS DataView 24hr plots (eg RS DataView BETA)
She would like to know how the time position of these markers are determined, and where the metadata (name, depth, magnitude) come from.
We have searched and read around the RS website(s), but have not been able to find this information, apologies if it is already published somewhere that we didn’t find.
Yes, the markers are a functionality that we are developing step-by-step. The data regarding the earthquakes is provided by our own network system, of which you can find more information on its related FDSN page: FDSN: AM: Raspberry Shake
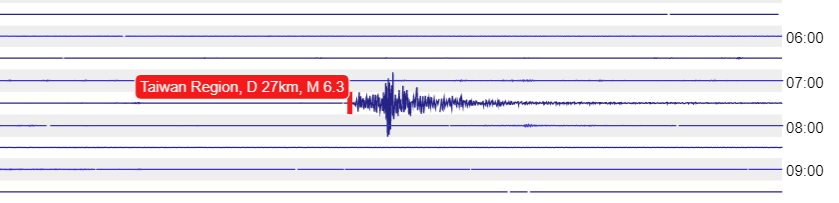
Our functionality acquires the details regarding major events, such as this M6.3 near Taiwan, and then calculates (using the iasp91 model, I believe) the travel time between the Shake and the epicenter of the event, to show then the marker on the helicorder window.
Not all quakes are currently displayed, and if your wife is finding the function distracting, there is the possibility to disable the annotations from the Settings window (by clicking on the gear icon up on the right) via toggling the appropriate switch.
Thank you for the speedy and helpful reply. She is finding the markers really useful to locate the events on different Shakes, so doesn’t want to turn them off, and it is useful to know that they are a work in progress as this explains why they sometimes are not shown
The reason I asked about the source of the metadata is because she has noticed some differences in the reported depths (that are larger than a rounding error) between the markers and the USGS record for the same event. I guessed that this was due to a different data source that is processing different data, or using a different algorithm, but it would be useful is that could be confirmed.
Yes, as of now the system displays local stronger events, which are of most interest for people who may have experienced them and want more information, or for people who want to study data from the closest Shakes to a particular earthquake, like in your case.
Our system calculates all the metadata based on what it is possible to determine from our network. Having more and more Shakes in the future, thus increasing our density, will help in being able to calculate even more precise datasets.
In my RS Dataview not one event is shown, although the function is enabled. For example I would have expected to see Tonga and Fiji on this view.
Kind regards
Yes, as of now, the function that automatically labels the various events on DataView only displays events that can be identified without filtering, as this element introduces more complexity to the code in reference to the distance between the station and the earthquake epicenter.
Thus, events that are only visible with filtering (because very far away, even if large) as in your case on November 11 for your station, will not appear, for now, with labels. In the future, we hope to expand this functionality to be more adaptive and performant, and identify earthquakes even with these additional conditions.